
Equity index funds enjoyed record net inflows of capital in the second quarter, according to the latest Fund Flow Index (FFI) from Calastone, the largest global funds transaction network. Meanwhile, by contrast, active funds suffered record outflows.
Between March and June, a net £2.1bn flowed into index-tracking equity funds, the largest inflow Calastone’s index has ever recorded, compared to £1.9bn that was withdrawn from actively managed funds. The last time withdrawals from active funds came even remotely close to current levels was a £1.1bn outflow in mid-2016, in the three-month run-up to the Brexit referendum.
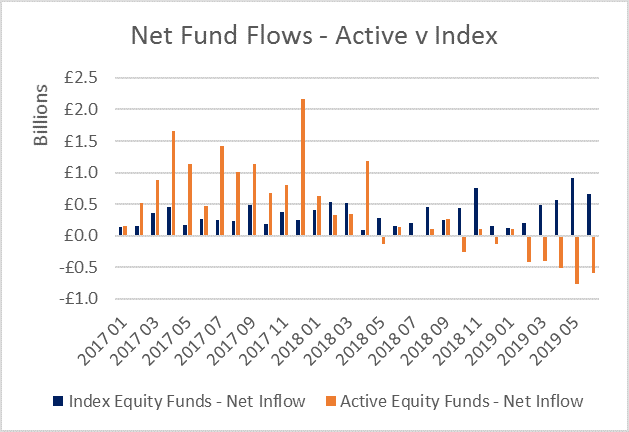 In recent years, index funds have been steadily catching up with their actively managed competitors. In 2015, for example, active equity funds enjoyed £15.3bn of inflows, compared to £1.8bn for index trackers, a ratio of almost 9:1. In 2018, index trackers already saw larger inflows than active funds, but so far in 2019, active funds have shed £2.6bn, while trackers have absorbed over £2.9bn of inflows. Active funds have now seen outflows for five consecutive months, the longest run of redemptions on the FFI record.
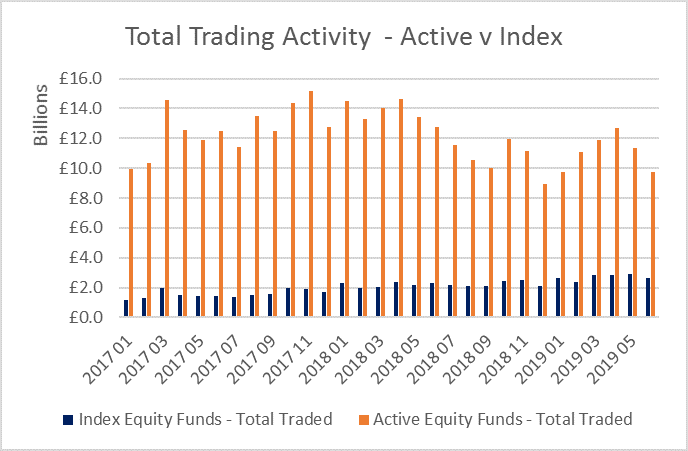
Calastone’s Fund Flow Index also reveals that the trading patterns are very different. Two-way trading is much higher in active funds than in index-trackers. Over the last year, the combined value of buy and sell trades in active equity funds has been 52x larger than the net flow of capital (ie buys minus sells). For index funds, the total value of trades was just 6x larger than the net inflow. That means there is a lot of switching between active funds, while for index funds, there is very little two-way trading, meaning money is flowing into funds much more steadily, with little chopping and changing.
In recent years, index funds have been steadily catching up with their actively managed competitors. In 2015, for example, active equity funds enjoyed £15.3bn of inflows, compared to £1.8bn for index trackers, a ratio of almost 9:1. In 2018, index trackers already saw larger inflows than active funds, but so far in 2019, active funds have shed £2.6bn, while trackers have absorbed over £2.9bn of inflows. Active funds have now seen outflows for five consecutive months, the longest run of redemptions on the FFI record.
Calastone’s Fund Flow Index also reveals that the trading patterns are very different. Two-way trading is much higher in active funds than in index-trackers. Over the last year, the combined value of buy and sell trades in active equity funds has been 52x larger than the net flow of capital (ie buys minus sells). For index funds, the total value of trades was just 6x larger than the net inflow. That means there is a lot of switching between active funds, while for index funds, there is very little two-way trading, meaning money is flowing into funds much more steadily, with little chopping and changing.
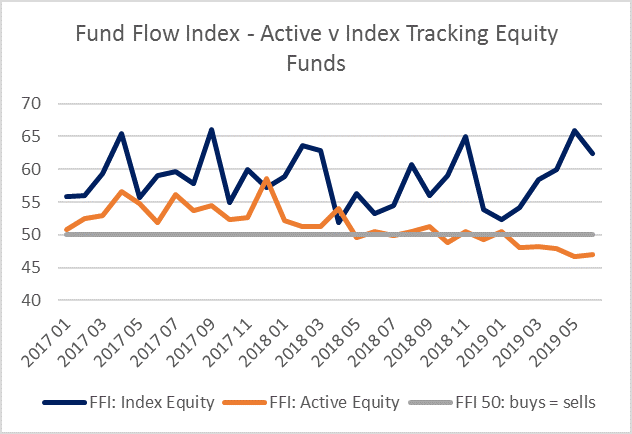 Even though the net inflow of capital to index trackers in Q2 was similar in value to the net outflow from active funds, the FFI: Equity Index Tracker was much more positive. It registered 62.8, well above the neutral 50 mark where buys equal sells, while the FFI: Equity Active averaged 47.2, a negative reading that is nevertheless close to the neutral 50. This is because index funds are enjoying very little selling – trading activity is much more one-directional. By contrast, the net outflow of capital from active funds has resulted after a lot of two-way trading. Calastone’s index therefore puts the net flow of funds into the context of overall investor activity.
Edward Glyn, head of global markets at Calastone said: “The value of active funds under management still hugely outweighs index-trackers, but the flows are markedly different. There are three factors at work that explain the figures. First of all, there is the long-term, structural trend that is seeing index funds mop up the majority of new savings into equities as investors seek low-cost, simple products. Their prevalence in regular savings plans also means they are less prone to sudden reversals. Secondly, there are cyclical forces at work: when investors become more concerned about the outlook for share prices, but do not wish to lose all their exposure to equities, index funds become a logical, lower-risk option for some of the money they are taking out of active funds – the investor can simply own the market, rather than trying to take active bets that could go wrong. The fact that the index v active trend is strongest in emerging markets and North America supports this interpretation, since the former have the riskiest equity markets and the latter the most highly valued. Finally, recent negative publicity about high-profile active funds is affecting sentiment around that segment of the market and may be accelerating redemptions in the short term.”
Across the wider funds market, fixed income funds continued to benefit from strong inflows in June, taking the Q2 total to a net £2.0bn, another sign of the reduction in investor risk appetite. Real estate funds saw a record ninth month of outflows. Mixed assets enjoyed continued inflows, though these are tracking a little below average at present.
Equity income funds saw their highest outflows in almost a year in June, as £358m left the sector. This suggests that there may be some contagion across the category caused by the publicity affecting a well-known fund, in which trading was suspended at the end of May.
Even though the net inflow of capital to index trackers in Q2 was similar in value to the net outflow from active funds, the FFI: Equity Index Tracker was much more positive. It registered 62.8, well above the neutral 50 mark where buys equal sells, while the FFI: Equity Active averaged 47.2, a negative reading that is nevertheless close to the neutral 50. This is because index funds are enjoying very little selling – trading activity is much more one-directional. By contrast, the net outflow of capital from active funds has resulted after a lot of two-way trading. Calastone’s index therefore puts the net flow of funds into the context of overall investor activity.
Edward Glyn, head of global markets at Calastone said: “The value of active funds under management still hugely outweighs index-trackers, but the flows are markedly different. There are three factors at work that explain the figures. First of all, there is the long-term, structural trend that is seeing index funds mop up the majority of new savings into equities as investors seek low-cost, simple products. Their prevalence in regular savings plans also means they are less prone to sudden reversals. Secondly, there are cyclical forces at work: when investors become more concerned about the outlook for share prices, but do not wish to lose all their exposure to equities, index funds become a logical, lower-risk option for some of the money they are taking out of active funds – the investor can simply own the market, rather than trying to take active bets that could go wrong. The fact that the index v active trend is strongest in emerging markets and North America supports this interpretation, since the former have the riskiest equity markets and the latter the most highly valued. Finally, recent negative publicity about high-profile active funds is affecting sentiment around that segment of the market and may be accelerating redemptions in the short term.”
Across the wider funds market, fixed income funds continued to benefit from strong inflows in June, taking the Q2 total to a net £2.0bn, another sign of the reduction in investor risk appetite. Real estate funds saw a record ninth month of outflows. Mixed assets enjoyed continued inflows, though these are tracking a little below average at present.
Equity income funds saw their highest outflows in almost a year in June, as £358m left the sector. This suggests that there may be some contagion across the category caused by the publicity affecting a well-known fund, in which trading was suspended at the end of May.
