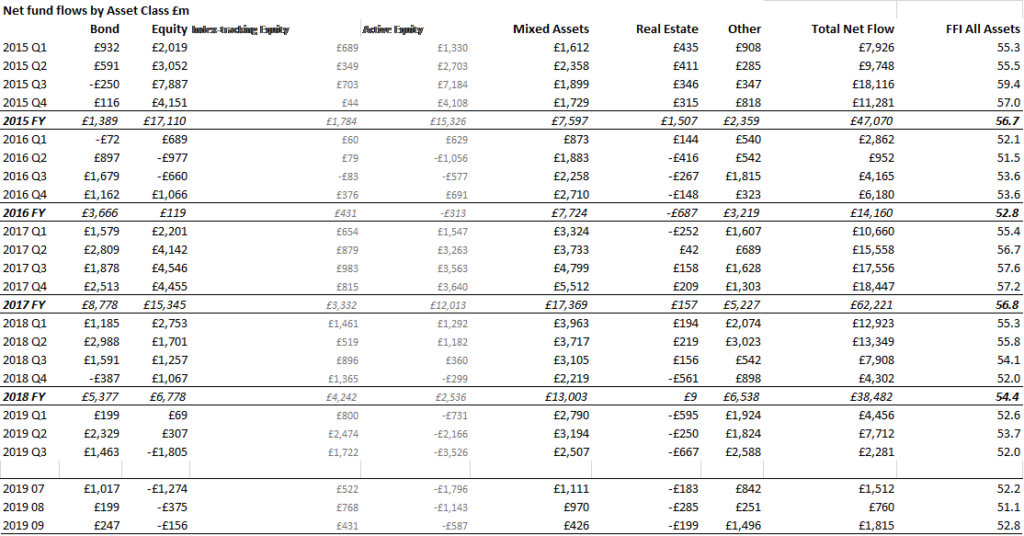
Active equity funds notched up a record fourth consecutive quarter of outflows in Q3, putting them comfortably on track for their worst year ever for 2019, according to the Fund Flow Index (FFI) from Calastone, the largest global funds transaction network. An unprecedented £3.5bn flooded out of active equity funds between July and September alone, more than in the previous three quarters combined. The FFI: Active Equity dropped to just 44.9 in Q3, its lowest level on record (a reading of 50 means inflows equal outflows).
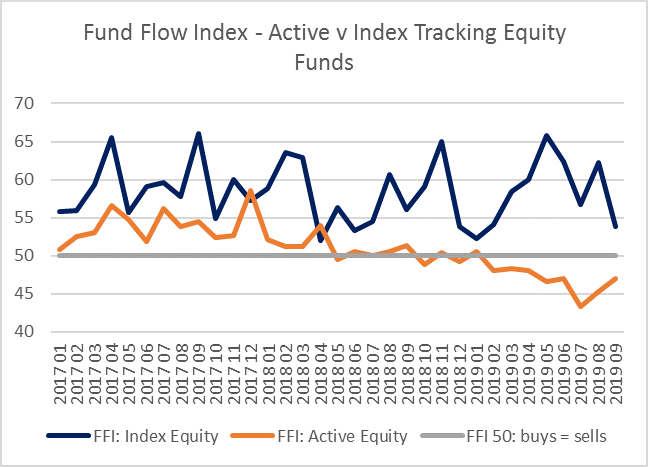 Figure 1: FFI Active Equity v Equity Index
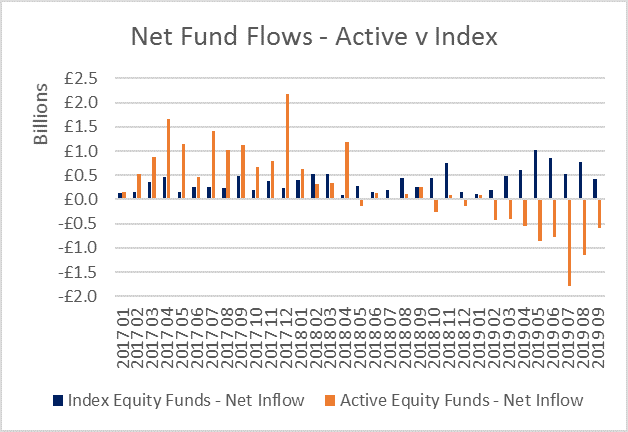 Figure 2: Net fund flows - Active Equity v Equity Index
Active UK equity funds were hit hardest, shedding a net £1.2bn, with a further £796m leaving equity income funds, most of whose assets are invested in UK equities. Funds focusing on equities in Europe, North America and Asia all saw outflows too. Active global funds bucked the trend, however.
Meanwhile, index funds enjoyed a twelfth consecutive quarter of strong inflows in Q3, totalling £1.7bn, equivalent to FFI: Index Equity of 56.7. Over the last twelve months, £6.4bn has flowed into passive equity funds, almost double the previous record twelve-month period (calendar year 2017).
Inflows to equity index funds in Q3 were nowhere near enough, however, to offset the outflows from active ones. Investors sold down a net £1.8bn of equity funds in Q3, double the previous worst quarter for equity funds in Q2 2016, ahead of the EU referendum. The FFI: Equity fell to a record low 46.3 in Q3. The quarter ended more positively than it began, however, as more stable markets staunched outflows in September – just £156m flowed out, equivalent to FFI: Equity of 49.5.
Calastone’s index revealed complementary trends across all asset classes. A flight from risk saw continued inflows to fixed income and money market funds, a record twelfth consecutive monthly outflow in September from property funds, the worst ever outflows from high-risk absolute return funds, an unprecedented fifth consecutive quarter of outflows from commodity funds, and even a sharp drop in inflows mixed asset funds, which normally see much more stability than other categories.
Figure 2: Net fund flows - Active Equity v Equity Index
Active UK equity funds were hit hardest, shedding a net £1.2bn, with a further £796m leaving equity income funds, most of whose assets are invested in UK equities. Funds focusing on equities in Europe, North America and Asia all saw outflows too. Active global funds bucked the trend, however.
Meanwhile, index funds enjoyed a twelfth consecutive quarter of strong inflows in Q3, totalling £1.7bn, equivalent to FFI: Index Equity of 56.7. Over the last twelve months, £6.4bn has flowed into passive equity funds, almost double the previous record twelve-month period (calendar year 2017).
Inflows to equity index funds in Q3 were nowhere near enough, however, to offset the outflows from active ones. Investors sold down a net £1.8bn of equity funds in Q3, double the previous worst quarter for equity funds in Q2 2016, ahead of the EU referendum. The FFI: Equity fell to a record low 46.3 in Q3. The quarter ended more positively than it began, however, as more stable markets staunched outflows in September – just £156m flowed out, equivalent to FFI: Equity of 49.5.
Calastone’s index revealed complementary trends across all asset classes. A flight from risk saw continued inflows to fixed income and money market funds, a record twelfth consecutive monthly outflow in September from property funds, the worst ever outflows from high-risk absolute return funds, an unprecedented fifth consecutive quarter of outflows from commodity funds, and even a sharp drop in inflows mixed asset funds, which normally see much more stability than other categories.
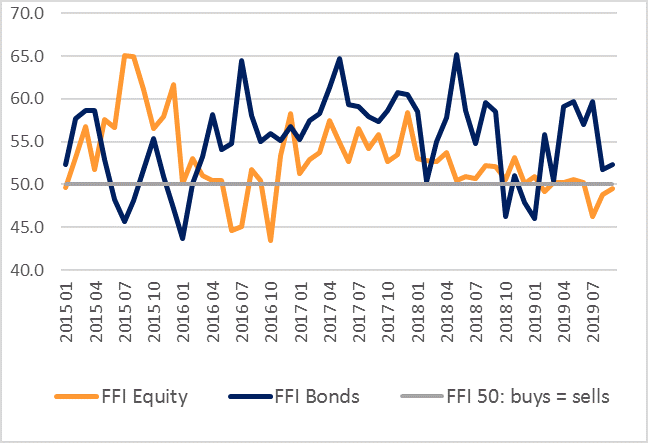 Figure 3: Bonds v FFI: Equity
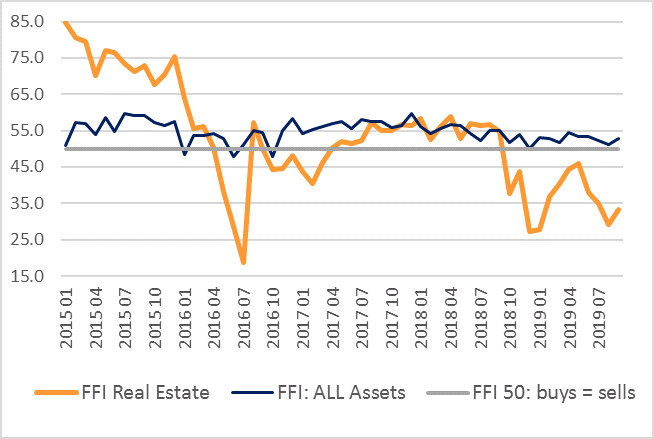 Figure 4: FFI: Real Estate
Edward Glyn, head of global markets at Calastone said: “As an asset class, equities are firmly out of favour among UK investors, and especially active equity funds. What began as a trickle of funds out of active equity funds late last year swelled to a flood over the summer as investors grew more fearful over the health of the global economy. The exodus slowed a touch in September, but it’s now a near certainty that in 2019 active funds will suffer their first full year of outflows.
Perhaps counterintuitively, global funds continue to attract inflows, however. This is because in uncertain times investors would rather spread their risk across the whole range of global stock markets, than attempt to pick the winning region. They are reducing their exposure to equities overall, but allowing their remaining holdings to concentrate increasingly into global funds, already the largest single category by assets under management. The particular distaste for UK assets, however, is a very clear response to the ever-intensifying political crisis, especially now that it is accompanied by clear evidence of economic damage too.
The growing divergence between appetite for active and passive funds is a clear, structural step-change in UK investor behaviour. Investors are cementing passive funds into their regular savings plans, and trading them far less frequently than their active holdings. Passive equity funds under management in the UK are still smaller than active funds, but they are growing much faster.
More widely, the absence of risk appetite by UK investors has been really stark in Q3. Asset classes associated with greater stability are benefitting from investor nerves. The picture improved a little in September, but it’s too soon to call time on investor fear.”
Figure 4: FFI: Real Estate
Edward Glyn, head of global markets at Calastone said: “As an asset class, equities are firmly out of favour among UK investors, and especially active equity funds. What began as a trickle of funds out of active equity funds late last year swelled to a flood over the summer as investors grew more fearful over the health of the global economy. The exodus slowed a touch in September, but it’s now a near certainty that in 2019 active funds will suffer their first full year of outflows.
Perhaps counterintuitively, global funds continue to attract inflows, however. This is because in uncertain times investors would rather spread their risk across the whole range of global stock markets, than attempt to pick the winning region. They are reducing their exposure to equities overall, but allowing their remaining holdings to concentrate increasingly into global funds, already the largest single category by assets under management. The particular distaste for UK assets, however, is a very clear response to the ever-intensifying political crisis, especially now that it is accompanied by clear evidence of economic damage too.
The growing divergence between appetite for active and passive funds is a clear, structural step-change in UK investor behaviour. Investors are cementing passive funds into their regular savings plans, and trading them far less frequently than their active holdings. Passive equity funds under management in the UK are still smaller than active funds, but they are growing much faster.
More widely, the absence of risk appetite by UK investors has been really stark in Q3. Asset classes associated with greater stability are benefitting from investor nerves. The picture improved a little in September, but it’s too soon to call time on investor fear.”