
Fund flows are responding in surprising ways to the highest recorded volatility in the history of financial markets and the associated stock market crash, according to the latest Fund Flow Index (FFI) from Calastone, the largest global funds network. In a month of superlatives, overall, UK-based funds have seen the largest outflows on record for any month by a long shot, the most week-to-week volatility, and the biggest divergence between the appetite for different asset types on Calastone’s record. The FFI: All Assets dropped to a record low of 47.2 (a reading of 50 means buys equal sells).
Investors redeemed a record £3.1bn of their fund holdings, almost exactly three times the previous worst month, June 2016, when the UK voted to leave the EU. With stock markets in free-fall for most of the month, dropping 25%(1) to their low point on 24th March before partially rebounding, equity funds might be expected to have borne the brunt. But this was not the case.
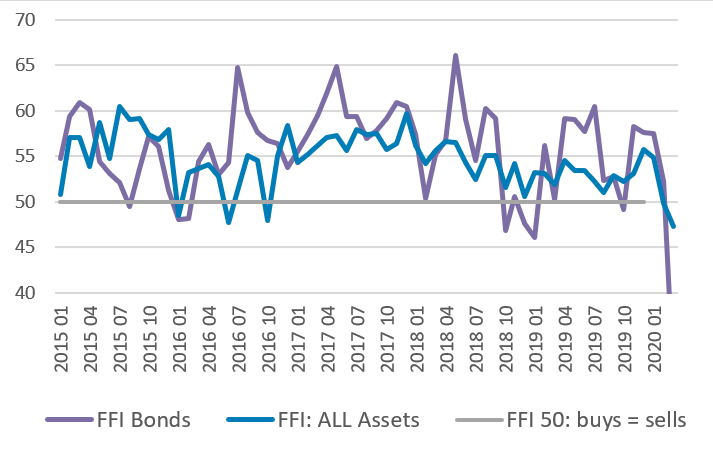
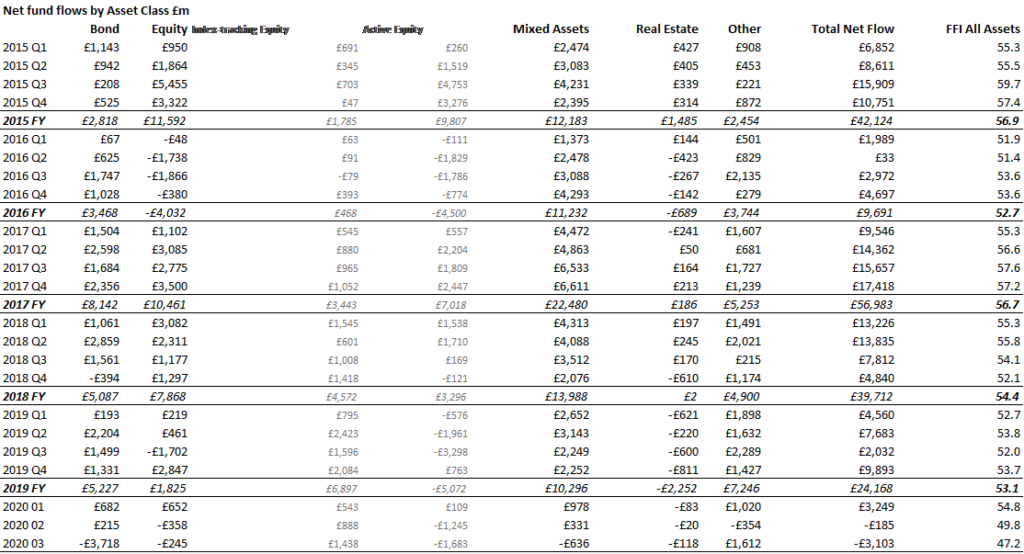
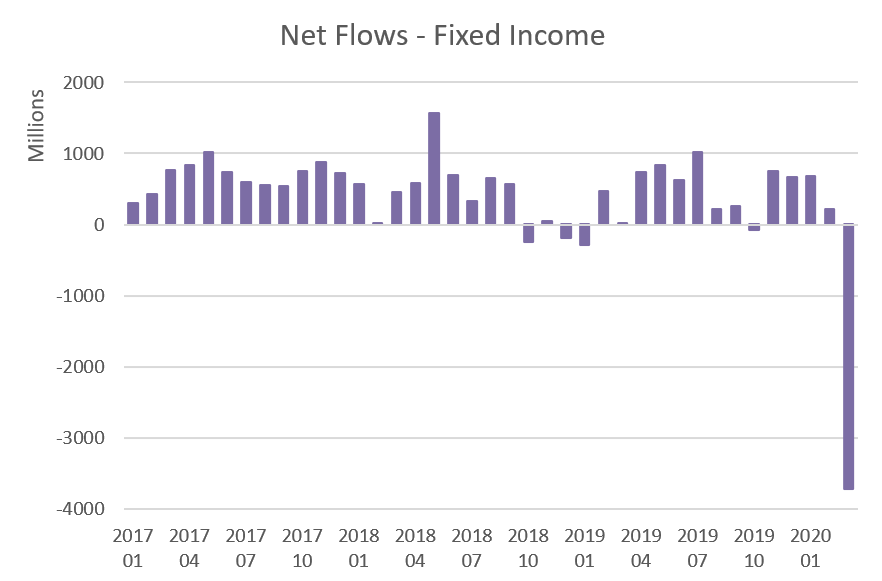 Instead the big story was in fixed income. By the end of the month an unprecedented £3.7bn of capital had left the sector, 13x more than in January 2019, the previous worst month. Outflows in March wiped out accumulated inflows from the preceding eight months. Investors reacted to sharply widening yield spreads as a focus on credit quality highlighted the risks that weak sovereign borrowers and corporates with overstretched balance sheets may find their debts unsustainable. In addition, investors were spooked by technical factors causing an acute dollar liquidity squeeze that required coordinated central bank remedies. Finally, quarter-end portfolio rebalancing drove bond sales. The FFI: Fixed income dropped to an unprecedented 30.4, meaning that selling activity was more than twice as large as buying.
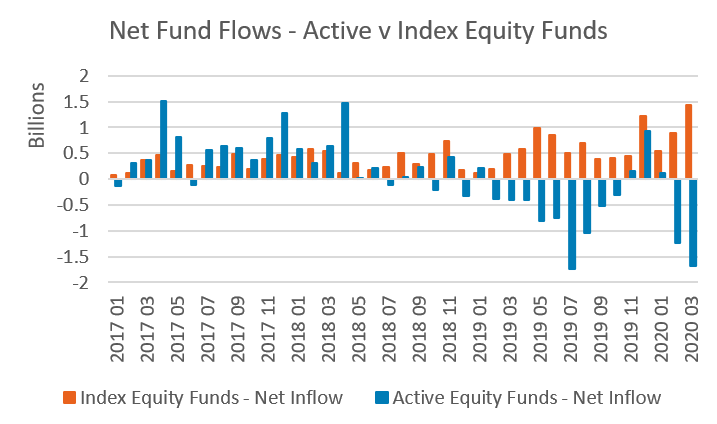
For equity funds overall, just £244m flowed out, barely a blip on the chart but investor reaction has been enormously varied as different flavours of equity fund have experienced very different flows. Most notably, passive funds have seen strong inflows, totalling a record £1.4bn. Meanwhile, active funds suffered their second-worst month on record, shedding £1.7bn. By the same token, European equity funds suffered their second worst outflow on record, losing £500m. Asian and North American funds also shed capital, but global funds enjoyed inflows.
Instead the big story was in fixed income. By the end of the month an unprecedented £3.7bn of capital had left the sector, 13x more than in January 2019, the previous worst month. Outflows in March wiped out accumulated inflows from the preceding eight months. Investors reacted to sharply widening yield spreads as a focus on credit quality highlighted the risks that weak sovereign borrowers and corporates with overstretched balance sheets may find their debts unsustainable. In addition, investors were spooked by technical factors causing an acute dollar liquidity squeeze that required coordinated central bank remedies. Finally, quarter-end portfolio rebalancing drove bond sales. The FFI: Fixed income dropped to an unprecedented 30.4, meaning that selling activity was more than twice as large as buying.
For equity funds overall, just £244m flowed out, barely a blip on the chart but investor reaction has been enormously varied as different flavours of equity fund have experienced very different flows. Most notably, passive funds have seen strong inflows, totalling a record £1.4bn. Meanwhile, active funds suffered their second-worst month on record, shedding £1.7bn. By the same token, European equity funds suffered their second worst outflow on record, losing £500m. Asian and North American funds also shed capital, but global funds enjoyed inflows.
 Funds focused on UK equities had their second-best month in four years, attracting £508m of new capital. Only December 2019 has seen bigger traffic. UK equity funds were also the first major category to see buying interest as calm returned.
Real estate fund managers gated their funds two thirds of the way through the month, no longer able to value their assets reliably and therefore judging it imprudent to attempt to meet cash calls with property sales. Money market funds saw £854m of inflows.
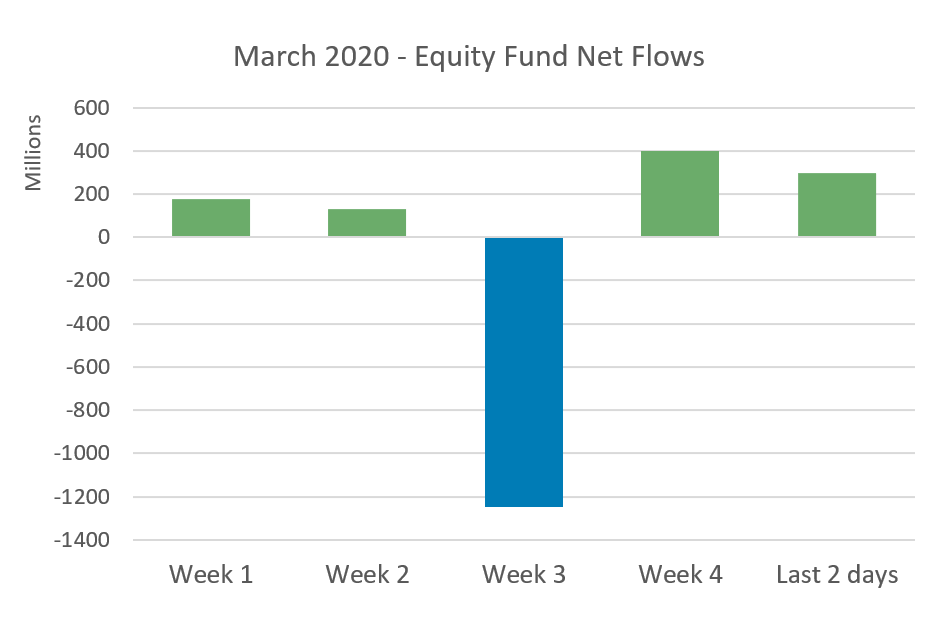
Over the course of the month, fund flows swung dramatically from week to week. The beginning of the month was marked by buying, the middle by indiscriminate selling, and the last few days by selective buying in growing volume.
Offshore funds suffered a similar overall outflow of £3.3bn to UK-domiciled ones, but only money market funds were beneficiaries of new capital. Fixed income, equity, mixed asset, commodity funds and other asset types all saw outflows.
Edward Glyn, head of global market said: “Market crises are superficially all the same as volatility soars and asset prices collapse, but they differ enormously in the detail. The temporary loss of fixed income as a safe-haven asset class to counterbalance some of the huge losses in equity markets left investors with little option but to ride it out or park their money in cash or cash-equivalents like money market funds. Equally the courage of investors not to dump their equity holdings is surprising. The COVID-19 crisis has undoubtedly had a bigger impact than the EU Referendum shock, yet so far equity funds are weathering the storm rather well. However long this crisis lasts and whatever other twists and turns it has in store, it has one thing in common with all the others. It will pass.”
Commenting on equity funds in particular he added: “The massive divergence between passive and active funds can be partially explained by long-term trends driving the growth of index investing and by the hard anchor of monthly direct debits, but these factors aren’t enough on their own to account for the huge disparity in March. It seems investors attempting to catch market troughs may simply be focusing on timing and just relying on the index to do the rest. But in fact, active managers tend to do rather well in difficult times for stock markets so the big outflows from that segment at a time of such big inflows to passive funds are a little surprising. The preference for UK-equity funds are easier to explain, reflecting a home-market bias and the exceptionally low valuation of the UK market compared to its international peers.”
Funds focused on UK equities had their second-best month in four years, attracting £508m of new capital. Only December 2019 has seen bigger traffic. UK equity funds were also the first major category to see buying interest as calm returned.
Real estate fund managers gated their funds two thirds of the way through the month, no longer able to value their assets reliably and therefore judging it imprudent to attempt to meet cash calls with property sales. Money market funds saw £854m of inflows.
Over the course of the month, fund flows swung dramatically from week to week. The beginning of the month was marked by buying, the middle by indiscriminate selling, and the last few days by selective buying in growing volume.
Offshore funds suffered a similar overall outflow of £3.3bn to UK-domiciled ones, but only money market funds were beneficiaries of new capital. Fixed income, equity, mixed asset, commodity funds and other asset types all saw outflows.
Edward Glyn, head of global market said: “Market crises are superficially all the same as volatility soars and asset prices collapse, but they differ enormously in the detail. The temporary loss of fixed income as a safe-haven asset class to counterbalance some of the huge losses in equity markets left investors with little option but to ride it out or park their money in cash or cash-equivalents like money market funds. Equally the courage of investors not to dump their equity holdings is surprising. The COVID-19 crisis has undoubtedly had a bigger impact than the EU Referendum shock, yet so far equity funds are weathering the storm rather well. However long this crisis lasts and whatever other twists and turns it has in store, it has one thing in common with all the others. It will pass.”
Commenting on equity funds in particular he added: “The massive divergence between passive and active funds can be partially explained by long-term trends driving the growth of index investing and by the hard anchor of monthly direct debits, but these factors aren’t enough on their own to account for the huge disparity in March. It seems investors attempting to catch market troughs may simply be focusing on timing and just relying on the index to do the rest. But in fact, active managers tend to do rather well in difficult times for stock markets so the big outflows from that segment at a time of such big inflows to passive funds are a little surprising. The preference for UK-equity funds are easier to explain, reflecting a home-market bias and the exceptionally low valuation of the UK market compared to its international peers.”
 (1) MSCI World