



Investors withdrew a net £1.41bn from equity funds in October, according to the latest Fund Flow Index from Calastone, the largest global funds network. It was the ninth-largest month on record for outflows and the third-largest this year. Equity funds have now seen outflows in 16 of the last 17 months.
Buyers’ retreat drives outflows with no obvious Budget effect in 2026
Notably, October’s rising equity-fund outflows (up from -£858m in September) reflected a sharp fall in buying rather than an increase in selling, while daily trading figures showed none of the pronounced activity around the Budget seen in the previous two years.
Buy orders for equity funds fell by £586m compared with September, but sell orders were essentially flat, down just 0.3% month-on-month or £38m. In other words, the greater retreat among buyers pushed net outflows higher, not a surge in selling.
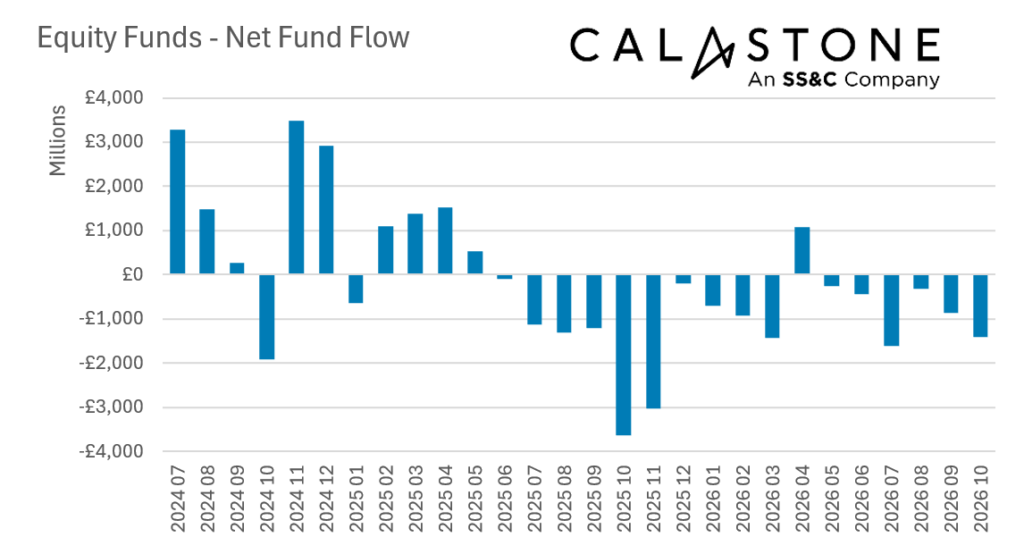
UK-focused equity funds bore the brunt of the withdrawals, shedding £815m in October and taking their year-to-date outflows to £5.27bn. The weakness was widespread, extending across almost every geographical category. Global funds shed £229m, Japanese funds £69m, and European funds £65m. Outflows from North American funds accelerated to £164m, with outflows increasing each month since July, when the funds last recorded inflows[1].
Emerging markets provided the sole exception, attracting £131m in October. They were also the only equity sector to attract new money in each of the last three months.
Passive funds see first outflows in three years
Cutting across geographical categories, both active and passive equity funds suffered withdrawals. Passive funds shed £44m, their first negative month since August 2023, indicating that the retreat from equities extended beyond the persistent pressure on active managers. Active funds saw outflows of £1.36bn.
Retreat from equities overall hits ESG hardest
Meanwhile, ESG equity funds (which also cut across geography) recorded their 9th consecutive month of outflows. Investors have withdrawn £5.13bn so far this year from ESG equity funds (and £754m in October), accounting for three-quarters of net outflows from equity funds overall in 2026. The figures suggest that ESG funds are a particular focus for withdrawals as investors seek to reduce their equity exposure more generally.
Fixed income and money markets attract new cash
Elsewhere, investors continued to add to bond funds, although inflows slowed to £302m from £655m in September. Safe-haven money market funds attracted £516m, their strongest inflows since the Budget-related surge in November 2025.
Property is making a comeback
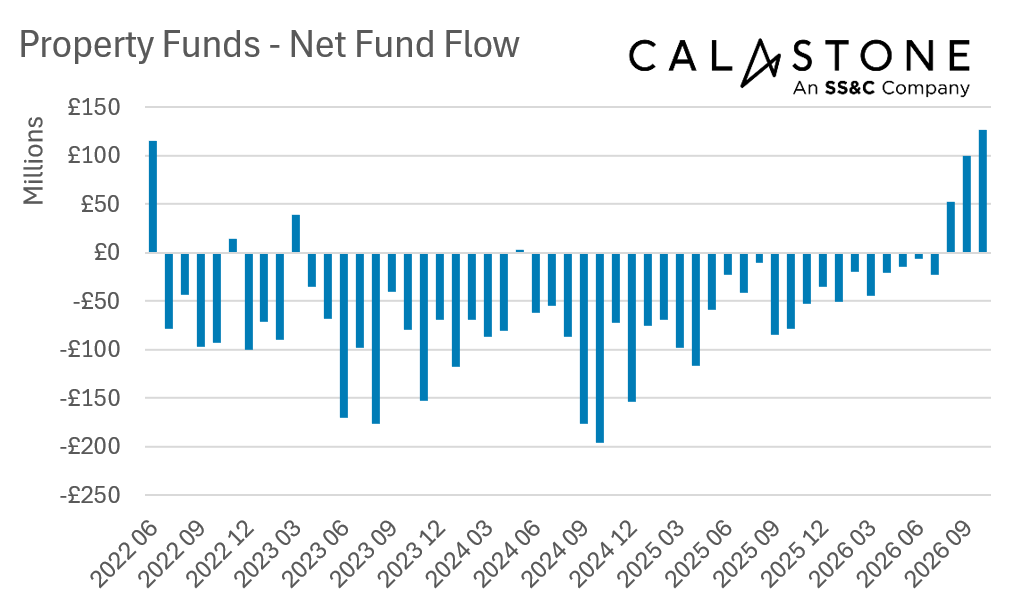
Property funds recorded a third consecutive month of inflows. October’s £127m was their strongest result since August 2018, when they attracted £186m.
[1] July +£227m; August -£2.9m; September -£124m; October -£164m
Edward Glyn, head of global markets at Calastone, said:
“Buyers stepping back did more damage to equity fund flows in October than sellers heading for the exit. That distinction reveals a weak appetite to commit new money, rather than a rush to liquidate investments. Even perennially popular passive funds could no longer buck the trend – the general reduction in equity allocations is finally hitting them too.
“In a welcome change from recent form, the Budget left little immediate trace. We saw no discernible change in investor activity on the days immediately before or after the announcement, unlike the previous two years. Moreover, because October’s higher outflow was driven by a lack of buyers, not an increase in selling, it does not suggest a repeat of investors rushing to crystallise gains ahead of a feared capital gains tax increase. Reports before the Budget that a rise had been ruled out may have removed one reason to act.
“Elsewhere, the ESG bust that started in early 2023 continues apace – two thirds of the capital the strategy accumulated during the 2019-2023 boom has now been withdrawn[2]. Investors reviewing their portfolios are questioning whether specialist ESG holdings still offer the exposure they want, particularly where these overlap with broader funds. ESG funds are therefore bearing the brunt of outflows as investors seek to trim their equity holdings overall.
“Emerging markets stand out for attracting consistent inflows in recent months, even as investors withdraw from other equity sectors. Meanwhile, stronger money market inflows show a continuing appetite to keep capital readily available. Property funds are also enjoying a sustained improvement in demand, although three positive months are an early indication rather than proof of a lasting recovery.”
[2] £10.9bn withdrawn from ESG equity since Feb 2023, compared to £16.1bn of inflows July 2019 to January 2023
Methodology
Calastone’s Fund Flow Index (FFI) is the most widely followed, most timely, and most comprehensive tracker of fund flows in the UK. Because it relies on real trading data by investors, rather than survey opinion, it is also the most accurate.
The FFI analyses millions of buy and sell orders in individual funds every month from millions of UK-based investors. More than 85% of all UK fund flows by value pass across Calastone’s network. To avoid double-counting, however, the analyst team excludes funds of funds. Totals are scaled up for Calastone’s market share.
Net fund flows are the difference between the value of investor buy orders and investor sell orders. The value of buy orders and the value of sell orders are both very large – the net flow is typically very small in comparison to this large amount of trading activity.
Calastone only measures orders from UK-based investors into funds domiciled in the UK. Note that this has nothing to do with where the underlying assets are invested – a UK-domiciled fund may invest in Japanese equities, Australian fixed income, a global portfolio of mixed assets, or just UK equities. The fund sector information breaks this down in detail.
Calastone uses the FE Fundinfo dataset to assign characteristics such as fund sector, or active v passive to each fund. Before December 2024 Calastone used Lipper for this function. Calastone has restated all historic data with the new FE Fundinfo data to ensure consistency. The new FE FundInfo provides enhanced coverage, and now includes many funds that are not classified by Lipper. The new FFI is therefore even more comprehensive than before, and the historic data now reflects this improvement. Calastone’s analysts do not judge there to be any material differences in the trends revealed using FE FundInfo classifications v Lipper, though there are minor points of detail that differ in individual months.