
Equity funds enjoyed their strongest inflows of 2019 in November following months of pessimism, according to the latest Fund Flow Index from Calastone, the largest global funds network. UK equity funds in particular welcomed inflows, as investors jockeyed for position ahead of the election. After shedding over £1bn in capital during the third quarter as investors fled the prospect of a disorderly Brexit at that time pencilled in for October, UK equity funds saw net new capital of £186m added in November. In October, fund flows were close to net zero.
The impact of the general election campaign is clear to see. Daily trading data shows the inflows were concentrated in the first half of the month, when opinion polls showed very large leads for the governing Conservative party. The Labour party spooked investors when it revealed its manifesto on 21st November promising huge corporate tax rises and the expropriation of listed-company shares in favour of employees: fund flows turned sharply negative as investors pulled £112m out of UK funds on the day of publication and the day after. The arguably cautious, low-key Conservative manifesto made little impact, however. The FFI:UK Equity measured 52.7 in November, its strongest reading in six months.
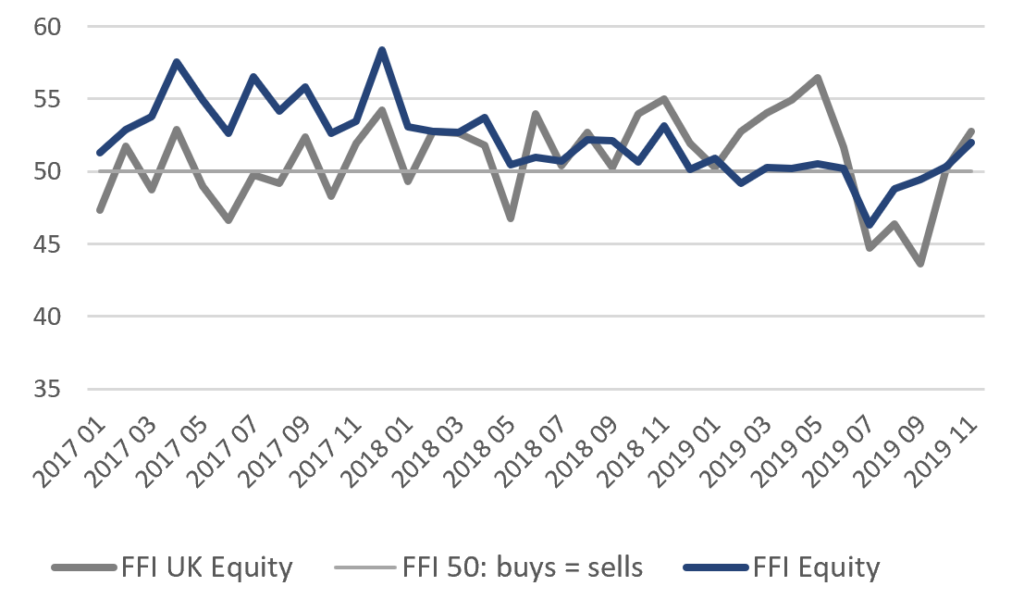 Equity funds more widely had a good November during what has been the worst year for equity funds on record for Calastone’s index* . Investors committed £556m of net new capital, the largest inflow since November 2018. The total is modest in comparison to inflows during bull-market years, but was substantial in the context of today’s nervous markets. It was big enough to offset half the net outflows suffered by equity funds so far this year. The Calastone FFI:Equity rose to 52.0 in November (a neutral reading of 50 means that the value of buy trades equals the value of sell trades, so that inflows match outflows).
November was also the first time since January that active equity funds attracted new capital, though this was flattered by technical factors around some significant institutional investor activity. Adjusting for these factors, active funds saw inflows almost exactly match outflows, still the best performance for active fund managers since January. The biggest inflows were to active global, UK, and sector funds. Active income and active European funds continued to shed capital rapidly, however. Despite the improvement for active funds, inflows to index funds were significantly larger and were positive across all equity fund categories except Europe. The FFI: Equity Index measured 56.0 in November, while the FFI: Active Equity rose above the neutral 50 mark for only the third time since April 2018, rising to 50.6.
Equity funds more widely had a good November during what has been the worst year for equity funds on record for Calastone’s index* . Investors committed £556m of net new capital, the largest inflow since November 2018. The total is modest in comparison to inflows during bull-market years, but was substantial in the context of today’s nervous markets. It was big enough to offset half the net outflows suffered by equity funds so far this year. The Calastone FFI:Equity rose to 52.0 in November (a neutral reading of 50 means that the value of buy trades equals the value of sell trades, so that inflows match outflows).
November was also the first time since January that active equity funds attracted new capital, though this was flattered by technical factors around some significant institutional investor activity. Adjusting for these factors, active funds saw inflows almost exactly match outflows, still the best performance for active fund managers since January. The biggest inflows were to active global, UK, and sector funds. Active income and active European funds continued to shed capital rapidly, however. Despite the improvement for active funds, inflows to index funds were significantly larger and were positive across all equity fund categories except Europe. The FFI: Equity Index measured 56.0 in November, while the FFI: Active Equity rose above the neutral 50 mark for only the third time since April 2018, rising to 50.6.
 Edward Glyn, head of global markets at Calastone said: “The prospect of an election breaking the UK’s political deadlock has certainly boosted the appetite for UK equities. Even a recent narrowing of the Conservative party’s lead in the polls is not yet impacting on fund flows. Investors are clearly signalling they would prefer a Conservative win, even if this brings the Brexit that has caused them to avoid UK equity funds in recent years. The fierce reaction to Labour’s manifesto suggests that a Labour win will lead to very significant and immediate moves out of UK equity funds following election day. Over the last three years, no new money has been committed to UK equity funds and asset valuations are cheap compared to global peers. There may be significant pent-up appetite to snap up bargains if political risks recede.
Stock markets have enjoyed a bounce as fears for the global economy have begun to recede. After a very tentative return to inflows in October, equity funds welcomed a much more decisive improvement in November - but sentiment is very fragile. There is still plenty that could go wrong, which is why November’s inflow, though the largest this year, is still only a third of the 2017 monthly average – at that time investors were celebrating the best of the bull market. Trade figures released at the end of November, for example, were the worst since 2009, highlighting the damaging effects of the US-China trade war, while markets fell sharply at the beginning of December following pugnacious remarks by President Trump over the prospects for a deal.”
Edward Glyn, head of global markets at Calastone said: “The prospect of an election breaking the UK’s political deadlock has certainly boosted the appetite for UK equities. Even a recent narrowing of the Conservative party’s lead in the polls is not yet impacting on fund flows. Investors are clearly signalling they would prefer a Conservative win, even if this brings the Brexit that has caused them to avoid UK equity funds in recent years. The fierce reaction to Labour’s manifesto suggests that a Labour win will lead to very significant and immediate moves out of UK equity funds following election day. Over the last three years, no new money has been committed to UK equity funds and asset valuations are cheap compared to global peers. There may be significant pent-up appetite to snap up bargains if political risks recede.
Stock markets have enjoyed a bounce as fears for the global economy have begun to recede. After a very tentative return to inflows in October, equity funds welcomed a much more decisive improvement in November - but sentiment is very fragile. There is still plenty that could go wrong, which is why November’s inflow, though the largest this year, is still only a third of the 2017 monthly average – at that time investors were celebrating the best of the bull market. Trade figures released at the end of November, for example, were the worst since 2009, highlighting the damaging effects of the US-China trade war, while markets fell sharply at the beginning of December following pugnacious remarks by President Trump over the prospects for a deal.”