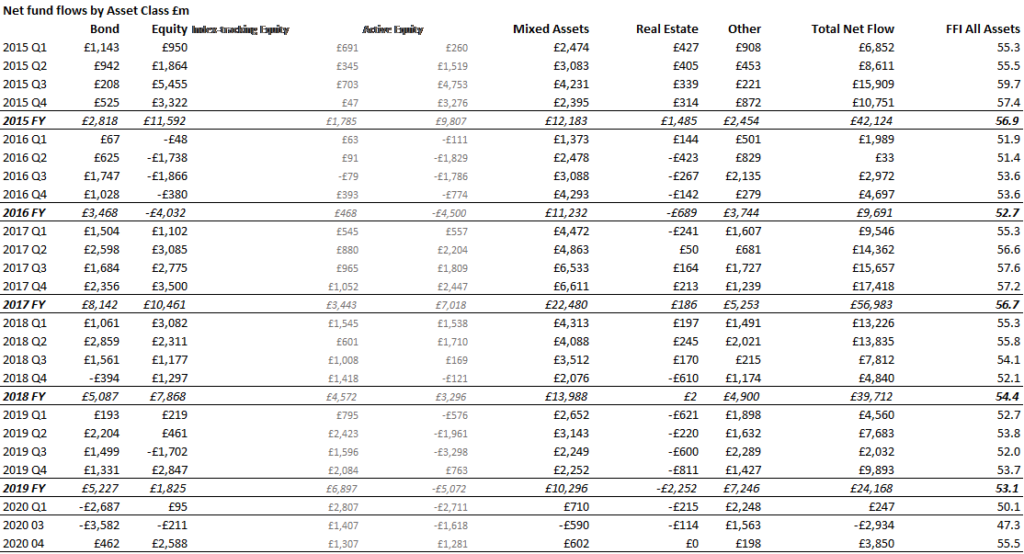
Equity funds enjoyed a flood of new capital in April as stock markets rebounded, according to the latest Fund Flow Index from Calastone, the largest global funds network. A record £2.6bn flowed into funds during the month, comfortably beating the previous best month for equity funds in July 2015. The April total was almost six times the average monthly inflow recorded over the last five years and came after two months of capital leaving the sector for the safety of cash as the COVID-19 pandemic ravaged the global economy and shattered market confidence.
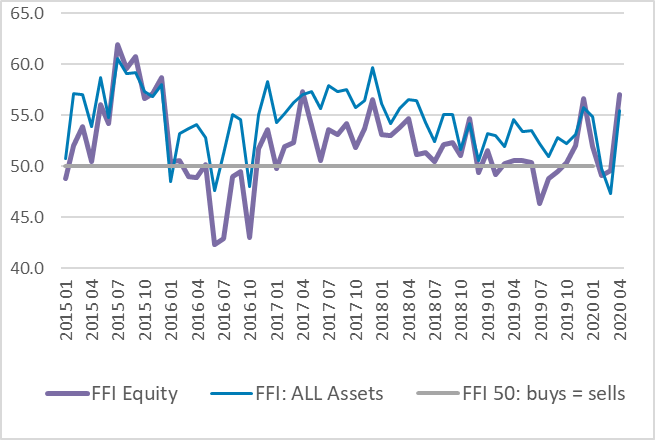
The Calastone FFI:Equity jumped to 57.1, its best reading in three years, but not a record (a reading of 50 means the value of buys equals the value of sells). This is because churn of funds was also rather high in April as investors busily traded their holdings – in other words, April’s record inflow of capital was the difference between a high volume of both sell and buy orders, rather than representing lots of buying and very little selling. Indeed, each of the first four months of 2020 has seen higher overall transaction volumes in equity funds than any previous month on record.
 Most of the buying took place in the middle of the month as evidence began to emerge that the outbreak was beginning to slow down in some of the worst-hit European countries. By the end of the month, inflows slowed to a trickle.
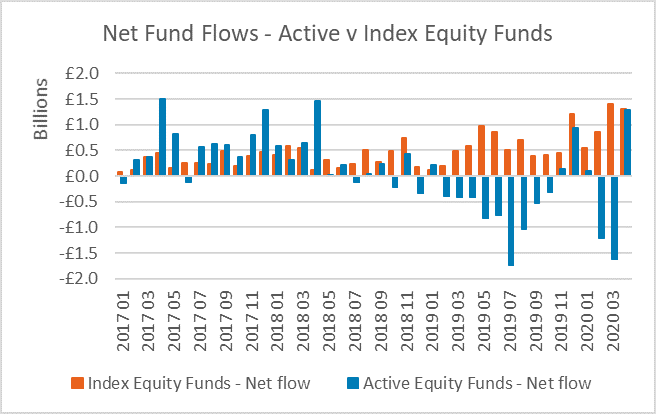
 The inflows to equity funds were split almost 50:50 between active and index flavours, though FFI:Equity Index itself registered a much more favourable 64.6 than the active equivalent of 54.6. A reading of 64.6 means that investors committed almost twice as much capital to index funds as they sold out. Active funds, by contrast, saw much busier two-way trading: the total trading volume was almost three times greater than passive funds in April, even though the net inflow (buys minus sells) was almost exactly the same.
 Global funds absorbed the most new money in April, adding a total of £1.1bn, easily the best month on record for the sector. Funds focused on UK equities were close behind, adding £1.0bn, the second-best month ever seen for these funds. Asian funds enjoyed their first inflows since November, while outflows from European funds slowed to their second lowest level since the end of 2018.
Among other asset classes, fixed income funds enjoyed a better month after the unprecedented outflows in March. £461m flowed in, following redemptions of £3.6bn in March, as calm returned to bond markets. Mixed asset funds also saw inflows, but real estate funds remained closed, so there was no activity. Money market funds were the only category to see outflows, as investors switched out of cash-equivalents and into riskier assets.
Edward Glyn, head of global markets at Calastone said: “Fear receded in April and capital flooded back into funds in its wake. As markets began to rise sharply, investors scrambled to add to their fund holdings, eager not to miss the best month for markets in 40 years. High trading volumes reflect the exceptional uncertainty in global markets – as the pandemic crisis has unfolded, investors have had to constantly assess and reassess the valuation of assets and prospects for the economy. Active funds tend to be the area in which this ongoing re-evaluation takes place, while passive funds see much steadier inflows over time.
Greater caution set in later in month, perhaps because investors began to question how solid the foundations of the rally could be given the mounting evidence of severe economic damage around the world, as well as White House sabre-rattling over new tariffs on China. Bear markets are often punctuated by brief moments of euphoria that see share prices inflate rapidly. But just as it is easier to puncture a balloon than knock down a wall, bear market rallies often deflate just as quickly as they occur. We don’t pretend to know which way share prices are going, but the slowdown in inflows suggests the uptick may at best be on pause for now.”


