
Rising share prices since the beginning of the year have done little to ignite investor enthusiasm for equity funds, according to the latest Fund Flow Index from Calastone, the largest global funds transaction network. Investors added a mere £62.7m to their equity fund holdings in April, taking the year-to-date total to £169m. This is a tiny drop in the ocean compared to the approximately £700bn* held in funds investing in equities, and is the weakest start to a year for equity funds in the FFI’s four-year history. Between January and April last year, by contrast, investors added £4.0bn to equity funds, even though stock market conditions were rocky. The FFI: Equity was just 50.2 in April, barely above the 50 neutral mark where buying activity equals selling activity. April was the fifth consecutive month that investors have been broadly neutral on equity funds - net flows have either been modestly negative or modestly positive.
Figure 1: FFI Equity v FFI Bonds
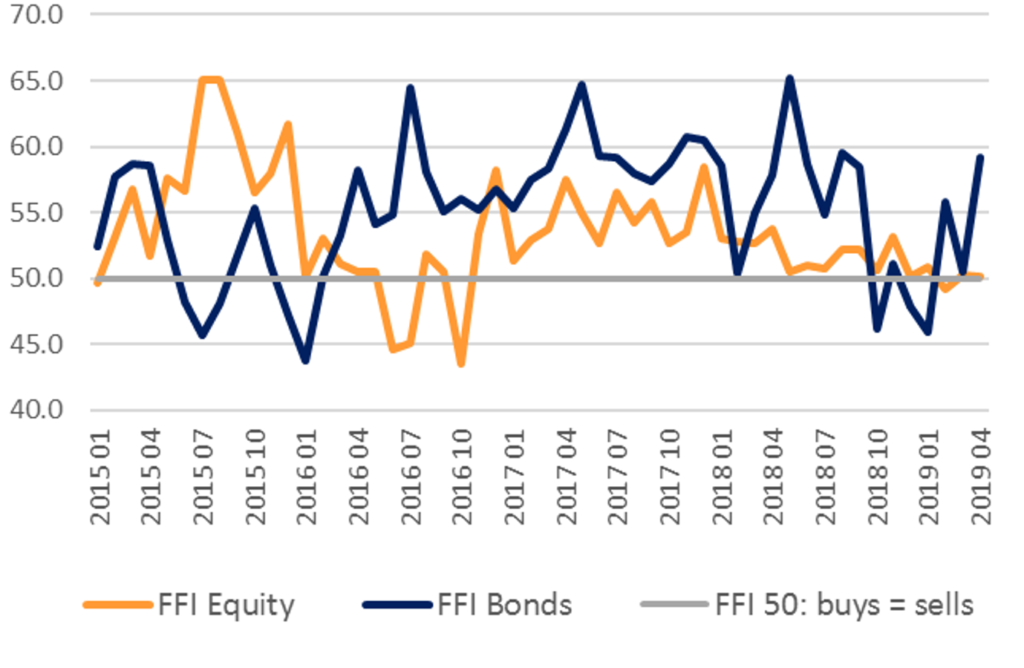 This is not to say investors are not actively engaging with their equity fund holdings. In fact, April saw the highest two-trading of equity funds on record, as a total £17.4bn turned over. This suggests significant switching between different types of equity funds, despite virtually no new money being committed to the sector. Net buying of UK equities to the tune of £376m was almost matched by net selling of equity income funds, for example. Meanwhile, European equity funds saw £252m in net outflows, as investors shunned continental equities for the seventh consecutive month, but global funds enjoyed inflows.
Bond funds have been the main beneficiaries of investor caution on equities. In April, fixed income funds saw the highest net inflows since May 2018, as £824m flowed in. Bond yields fell during the month as investors increasingly expected the US Federal Reserve to back away from any tightening of monetary policy. Bond yields move in the opposite direction to bond prices, so bond investors make gains when yields fall. The FFI: Bonds rose to a very positive 59.1.
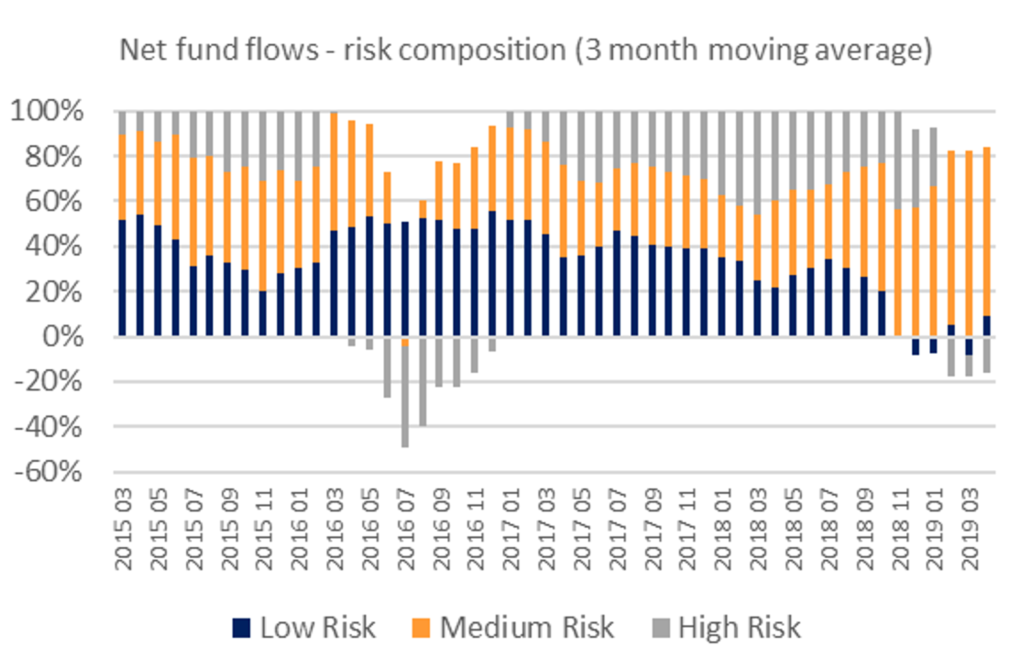
Risk aversion remains a significant theme among UK investors. The riskiest categories of funds saw £309m of outflows in April, while low- and moderate-risk funds saw inflows. Risky funds have now seen outflows in four of the last five months. The last time risk aversion was this high was in 2016 in the run up to, and immediate aftermath of, the Brexit referendum.
Figure 2: Proportion of inflows into each risk category of funds
This is not to say investors are not actively engaging with their equity fund holdings. In fact, April saw the highest two-trading of equity funds on record, as a total £17.4bn turned over. This suggests significant switching between different types of equity funds, despite virtually no new money being committed to the sector. Net buying of UK equities to the tune of £376m was almost matched by net selling of equity income funds, for example. Meanwhile, European equity funds saw £252m in net outflows, as investors shunned continental equities for the seventh consecutive month, but global funds enjoyed inflows.
Bond funds have been the main beneficiaries of investor caution on equities. In April, fixed income funds saw the highest net inflows since May 2018, as £824m flowed in. Bond yields fell during the month as investors increasingly expected the US Federal Reserve to back away from any tightening of monetary policy. Bond yields move in the opposite direction to bond prices, so bond investors make gains when yields fall. The FFI: Bonds rose to a very positive 59.1.
Risk aversion remains a significant theme among UK investors. The riskiest categories of funds saw £309m of outflows in April, while low- and moderate-risk funds saw inflows. Risky funds have now seen outflows in four of the last five months. The last time risk aversion was this high was in 2016 in the run up to, and immediate aftermath of, the Brexit referendum.
Figure 2: Proportion of inflows into each risk category of funds
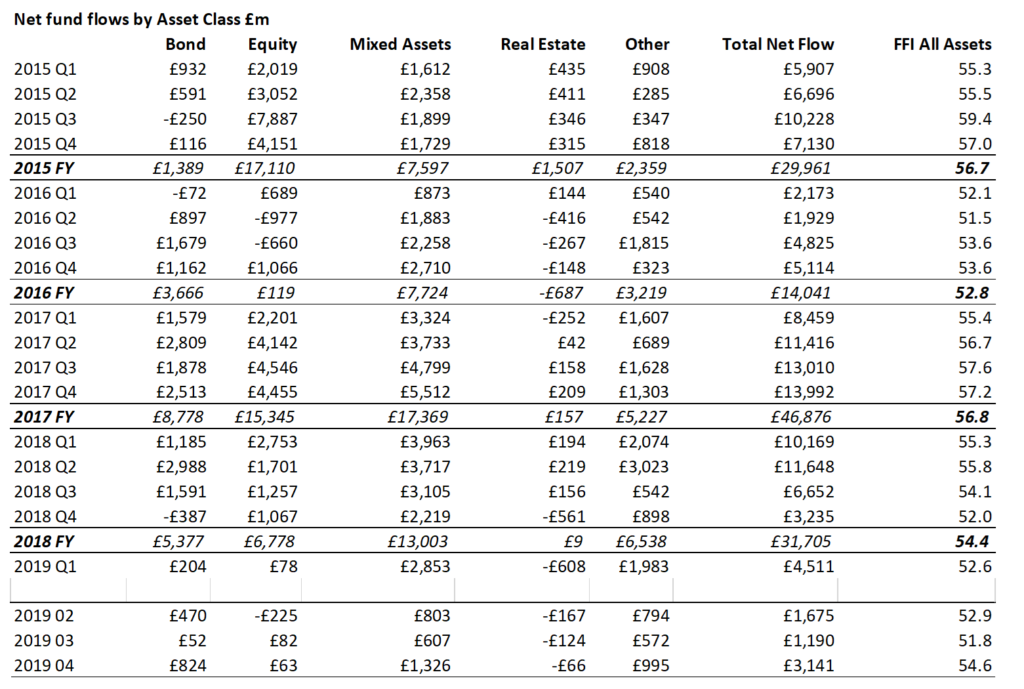
 The value of inflows to all asset classes was especially large in the first five days of April, as investors scrambled to take advantage of unused ISA allowances that would expire along with the financial year. Inflows tailed off as the month progressed.
For the whole of April, the Calastone FFI All Assets was a positive 54.6, as ISA inflows (in particular to mixed asset funds) combined with appetite for fixed income to more than offset redemptions from real estate funds, and exceptionally low inflows to equities.
Edward Glyn, Calastone’s Head of Global Markets, said: “Caution is the name of the game at the moment as we see investors shy away from risky funds. Share prices have risen strongly since December saw equity markets plunge sharply, but this has not been enough to tempt investors back into equity funds. If anything, seeing markets back near record highs is keeping investors on the sidelines, or rejigging their equity funds into sectors like UK equities that are attractively valued. Their enthusiasm for fixed income funds, meanwhile, is down to the likelihood that these will benefit from a potentially more benign outlook for interest rates.”
The value of inflows to all asset classes was especially large in the first five days of April, as investors scrambled to take advantage of unused ISA allowances that would expire along with the financial year. Inflows tailed off as the month progressed.
For the whole of April, the Calastone FFI All Assets was a positive 54.6, as ISA inflows (in particular to mixed asset funds) combined with appetite for fixed income to more than offset redemptions from real estate funds, and exceptionally low inflows to equities.
Edward Glyn, Calastone’s Head of Global Markets, said: “Caution is the name of the game at the moment as we see investors shy away from risky funds. Share prices have risen strongly since December saw equity markets plunge sharply, but this has not been enough to tempt investors back into equity funds. If anything, seeing markets back near record highs is keeping investors on the sidelines, or rejigging their equity funds into sectors like UK equities that are attractively valued. Their enthusiasm for fixed income funds, meanwhile, is down to the likelihood that these will benefit from a potentially more benign outlook for interest rates.”
 Methodology
Calastone analysed over a million buy and sell orders every month from January 2015, tracking monies from IFAs, platforms and institutions as they flow into and out of investment funds. Data is collected until the close of business on the last day of each month. A single order is usually the aggregated value of a number of trades from underlying investors passed for example from a platform via Calastone to the fund manager. In reality, therefore, the index is analysing the impact of many millions of investor decisions each month.
More than two thirds of UK fund flows by value pass across the Calastone network each month. All these trades are included in the FFI. To avoid double-counting, however, the team has excluded deals that represent transactions where funds of funds are buying those funds that comprise the portfolio. Totals are scaled up for Calastone’s market share.
A reading of 50 indicates that new money investors put into funds equals the value of redemptions (or sales) from funds. A reading of 100 would mean all activity was buying; a reading of 0 would mean all activity was selling. In other words, £1m of net inflows will score more highly if there is no selling activity, than it would if £1m was merely a small difference between a large amount of buying and a similarly large amount of selling.
Calastone’s main FFI All Assets considers transactions only by UK-based investors, placing orders for funds domiciled in the UK. The majority of this capital is from retail investors. Calastone also measures the flow of funds from UK-based investors to offshore-domiciled funds. Most of these are domiciled in Ireland and Luxembourg. This is overwhelmingly capital from institutions; the larger size of retail transactions in offshore funds suggests the underlying investors are higher net worth individuals.
*Source: Investment Association, Funds Under Management Feb 2019
Methodology
Calastone analysed over a million buy and sell orders every month from January 2015, tracking monies from IFAs, platforms and institutions as they flow into and out of investment funds. Data is collected until the close of business on the last day of each month. A single order is usually the aggregated value of a number of trades from underlying investors passed for example from a platform via Calastone to the fund manager. In reality, therefore, the index is analysing the impact of many millions of investor decisions each month.
More than two thirds of UK fund flows by value pass across the Calastone network each month. All these trades are included in the FFI. To avoid double-counting, however, the team has excluded deals that represent transactions where funds of funds are buying those funds that comprise the portfolio. Totals are scaled up for Calastone’s market share.
A reading of 50 indicates that new money investors put into funds equals the value of redemptions (or sales) from funds. A reading of 100 would mean all activity was buying; a reading of 0 would mean all activity was selling. In other words, £1m of net inflows will score more highly if there is no selling activity, than it would if £1m was merely a small difference between a large amount of buying and a similarly large amount of selling.
Calastone’s main FFI All Assets considers transactions only by UK-based investors, placing orders for funds domiciled in the UK. The majority of this capital is from retail investors. Calastone also measures the flow of funds from UK-based investors to offshore-domiciled funds. Most of these are domiciled in Ireland and Luxembourg. This is overwhelmingly capital from institutions; the larger size of retail transactions in offshore funds suggests the underlying investors are higher net worth individuals.
*Source: Investment Association, Funds Under Management Feb 2019