
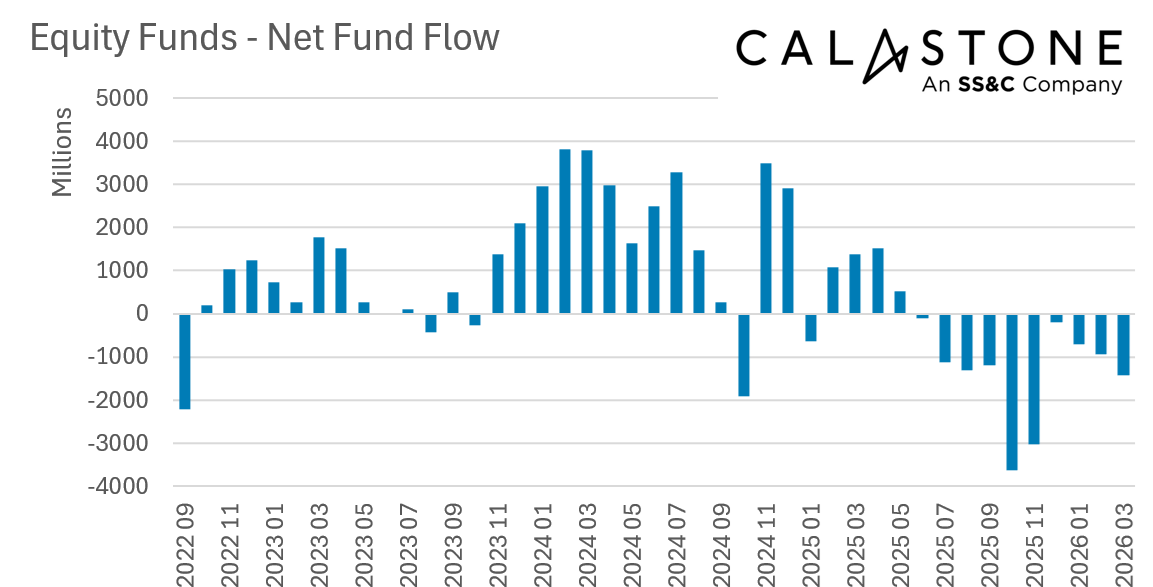
The war in the Middle East drove a sharp increase in outflows from equity funds in March, according to the latest Fund Flow Index from Calastone, the largest global funds network. Outflows surged to £1.44bn (up from £927m in February), making March the worst month since November when UK Budget concerns were driving significant selling. March’s outflows were the 7th worst on record and extended the run of equity fund outflows to an unprecedented 10 consecutive months.
Selling was broad-based
Every equity fund sector bar one saw outflows. The biggest deterioration in investor optimism was seen in European, Asia-Pacific, emerging markets and Japanese funds, all of which either saw outflows increase dramatically month-on-month or inflows turn to outflows.
UK equity funds saw the largest outflows but continue to see relative improvement
Although UK-focused funds saw the largest outflows in cash terms, the month-on-month increase was modest (rising from £555m to £592m). This follows a recent trend – UK funds remain subject to structural outflows, but the relative position has improved markedly.
Global funds hit by a rare month of outflows
Global funds also suffered net selling, but they saw outflows shrink to £205m (less than half February’s level). Even so this was still only the eleventh month on Calastone’s 12-year record that this perennially popular sector has ever seen net selling – in a sign of the times, eight of these have been in the last year.
North America was the only sector with inflows
The only sector to see inflows was North American equities, though these fell from £371m in February to just £99m in March.
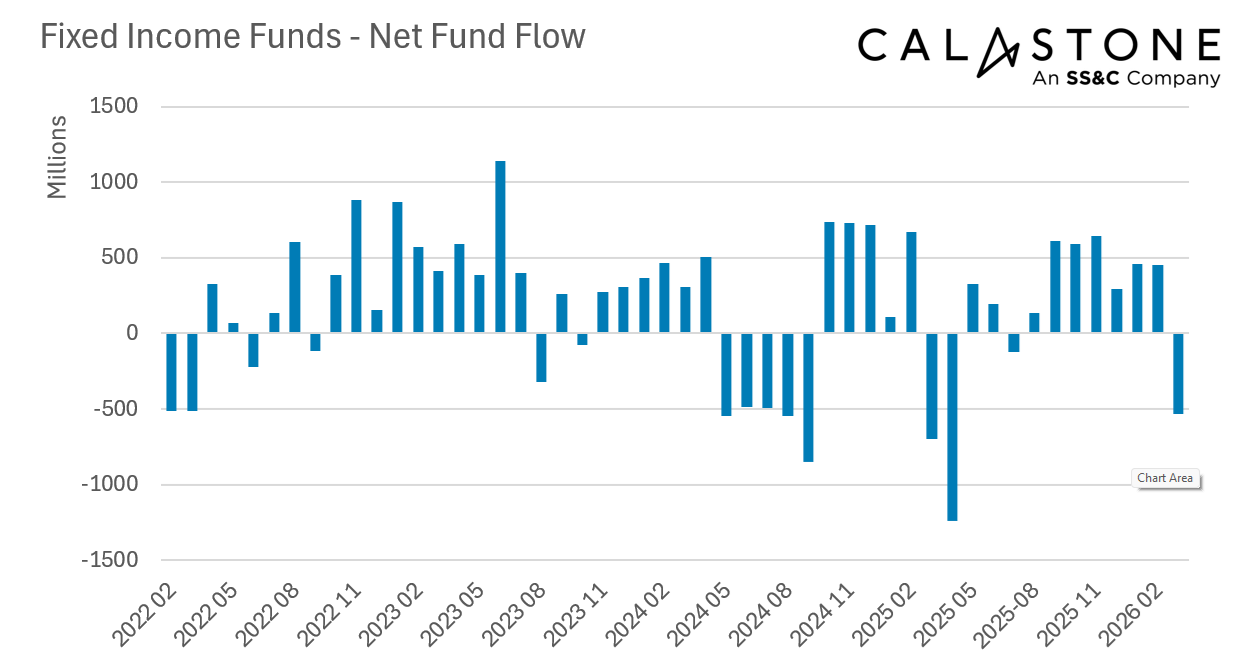
Falling bond markets drove net selling of fixed income funds
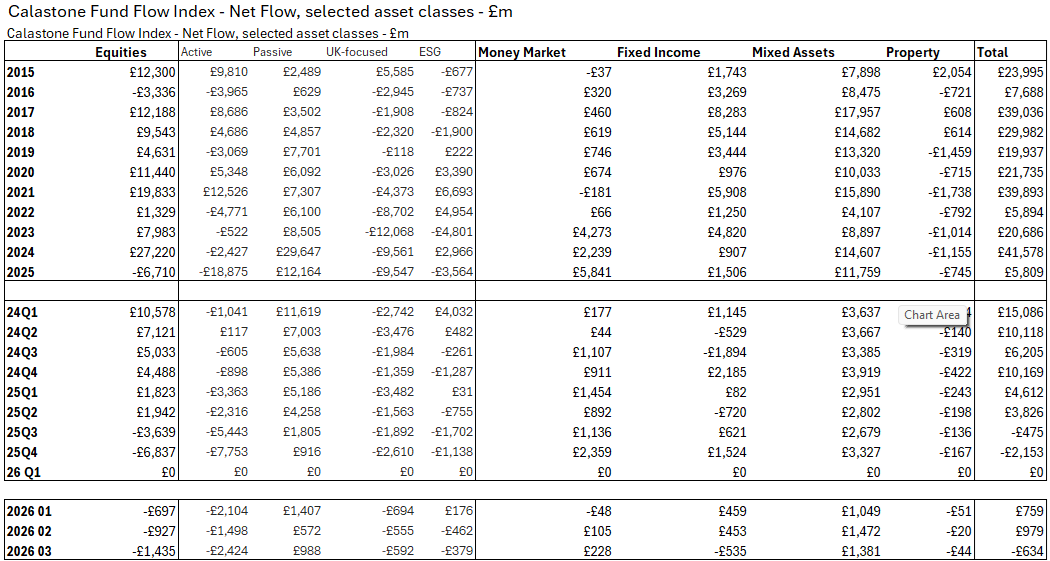
Among other asset classes, turmoil in bond markets meant fixed income funds did not benefit from the rush of cash exiting equity funds. With yields rising around the world on oil-shock inflation fears (and therefore bond prices falling), investors withdrew £535m of capital from bond funds, more than reversing February’s inflows. March was the worst month for fixed income funds since April last year and the seventh worst on record. Safe-haven money market fund inflows rose to £228m, their best month since the budget. Mixed asset funds, which are well anchored in monthly savings plans, continued to see inflows.
Edward Glyn, head of global markets at Calastone said: “Financial markets do not simply set prices – they are probability engines weighing the likelihood of future events. This helps explain why market movements, though large, have been relatively modest given the potential extent of the damage the oil crisis could have on the world economy. It also helps explain why outflows are not larger. Certainly, some fund investors are not waiting around to see what happens. They are voting with their feet and pulling capital out of risk assets in favour of cash. But the overall sentiment is not one of panic and outflows are still well below the levels caused by the Budget speculation – when retirees liquidated assets to beat a feared tax increase. For them, cashing in right away was important given a possible Budget cliff-edge.
“Much of the effect of the conflict in the Middle East is still unknown, and most investors do not need immediate liquidity. Although there are notable outflows at the margin, most are content to stay invested knowing that most crises look like blips through a long-term lens.”
Methodology
Calastone’s Fund Flow Index (FFI) is the most widely followed, most timely, and most comprehensive tracker of fund flows in the UK. Because it relies on real trading data by investors, rather than survey opinion, it is also the most accurate.
The FFI analyses millions of buy and sell orders in individual funds every month from millions of UK-based investors. More than 85% of all UK fund flows by value pass across Calastone’s network. To avoid double-counting, however, the analyst team excludes funds of funds. Totals are scaled up for Calastone’s market share.
Net fund flows are the difference between the value of investor buy orders and investor sell orders. The value of buy orders and the value of sell orders are both very large – the net flow is typically very small in comparison to this large amount of trading activity.
Calastone only measures orders from UK-based investors into funds domiciled in the UK. Note that this has nothing to do with where the underlying assets are invested – a UK-domiciled fund may invest in Japanese equities, Australian fixed income, a global portfolio of mixed assets, or just UK equities. The fund sector information breaks this down in detail.
Calastone uses the FE Fundinfo dataset to assign characteristics such as fund sector, or active v passive to each fund. Before December 2024 Calastone used Lipper for this function. Calastone has restated all historic data with the new FE Fundinfo data to ensure consistency. The new FE FundInfo provides enhanced coverage, and now includes many funds that are not classified by Lipper. The new FFI is therefore even more comprehensive than before, and the historic data now reflects this improvement. Calastone’s analysts do not judge there to be any material differences in the trends revealed using FE FundInfo classifications v Lipper, though there are minor points of detail that differ in individual months.
Calastone also calculates an index value to enable comparison between different asset classes and fund sectors of different sizes. A reading of 50 indicates that buy and sell orders are equal in value. A reading above 50 means capital is flowing in and a reading below 50 means it is flowing out. In other words, a net inflow of £1m would score much more highly if it is the difference between, say £10m of buys and £9m of sells than if it was the difference between £100m of buys and £99m of sells.