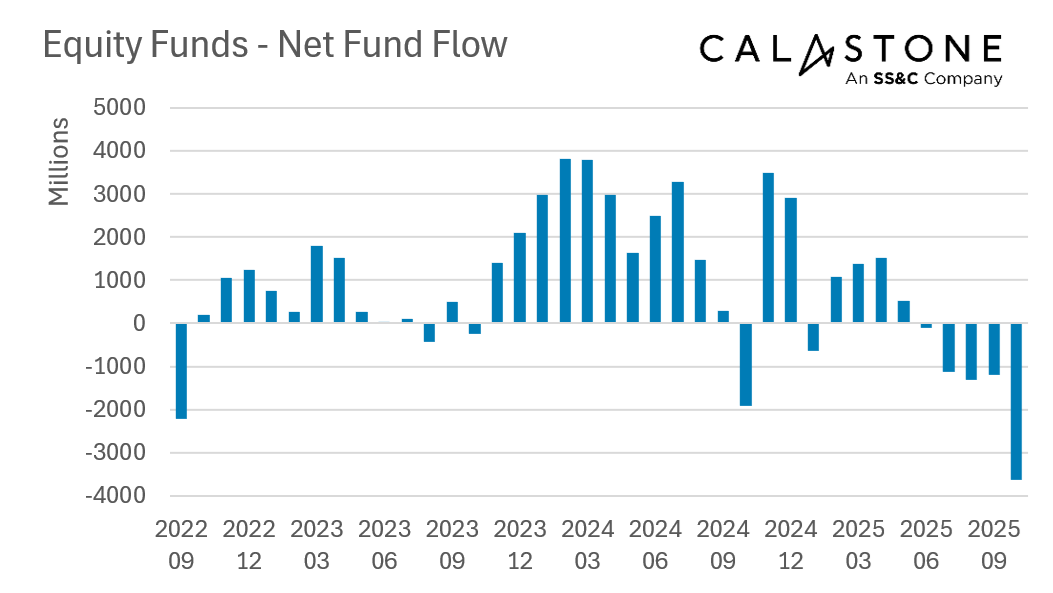
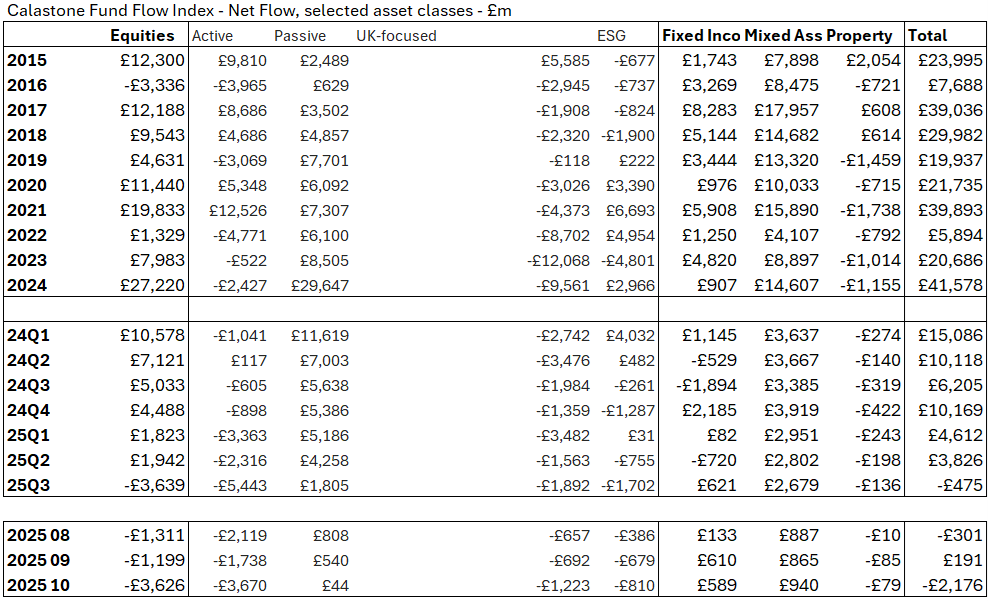
Equity funds suffered their largest outflows on record in October, according to the latest Fund Flow Index from Calastone, the largest global funds network. Investors withdrew a net £3.63bn from their equity fund holdings, marking a fifth consecutive month of outflows from the asset class, the longest stint of selling since the Brexit referendum in 2016. Between June and October, investors have pulled a net £7.36bn out of equity funds, easily the largest outflow on Calastone’s record.
Notably, every equity fund category saw net selling. UK-focused funds accounted for one third of the net selling – investors withdrew £1.22bn from the sector, taking the total since the run-up to 2025’s tax-raising budget to £10.42bn. An unprecedented fifth consecutive month of net selling in global funds saw a record £911m leave the sector, while North American funds shed £649m, their third worst month on record. Sector-focused equity funds also saw large outflows – the net £220m was almost entirely withdrawn from technology funds.
Safe-haven money market funds were the main beneficiary of investor sale proceeds. Inflows of £955m were a new record. Fixed income funds also had a good month with inflows of £589m, focused on corporate bonds and flexibly-managed funds – investors steered clear of sovereign bond funds.
Edward Glyn, Head of Global Markets at Calastone said: “Two forces are driving investor behaviour. One is simply nerves about global equity prices, especially in the US. Outflows from global, US and tech funds are all part of that story. Fears of high share prices also explain why money market and fixed income funds both had a good month – cash rolling out of equity funds needs somewhere to go, especially for those who don’t want to lose the tax protection of an ISA or pension wrapper.
“The other force stems from growing concern about Rachel Reeves’s budget and the anticipated tax implications. For some, it’s a simple matter of crystallising capital gains in case rates go up. This drove a huge uptick in selling this time last year and it’s clearly round two in 2026.
“For many others it’s about pensions. The tax-free lump sum that over 55s may draw from their pensions is such a vital part of most people’s retirement planning that the risk it will be scrapped or drastically scaled back is simply too concerning for many diligent pension savers in their 50s and beyond to contemplate.
“Speculation on policy has made this drastic step the only rational choice for many, even if it may ultimately harm their longer-term financial goals.”
Methodology
Calastone’s Fund Flow Index (FFI) is the most widely followed, most timely, and most comprehensive tracker of fund flows in the UK. Because it relies on real trading data by investors, rather than survey opinion, it is also the most accurate.
The FFI analyses millions of buy and sell orders in individual funds every month from millions of UK-based investors. More than 85% of all UK fund flows by value pass across Calastone’s network. To avoid double-counting, however, the analyst team excludes funds of funds. Totals are scaled up for Calastone’s market share.
Net fund flows are the difference between the value of investor buy orders and investor sell orders. The value of buy orders and the value of sell orders are both very large – the net flow is typically very small in comparison to this large amount of trading activity.
Calastone only measures orders from UK-based investors into funds domiciled in the UK. Note that this has nothing to do with where the underlying assets are invested – a UK-domiciled fund may invest in Japanese equities, Australian fixed income, a global portfolio of mixed assets, or just UK equities. The fund sector information breaks this down in detail.
Calastone uses the FE Fundinfo dataset to assign characteristics such as fund sector, or active v passive to each fund. Before December 2024 Calastone used Lipper for this function. Calastone has restated all historic data with the new FE Fundinfo data to ensure consistency. The new FE FundInfo provides enhanced coverage, and now includes many funds that are not classified by Lipper. The new FFI is therefore even more comprehensive than before, and the historic data now reflects this improvement. Calastone’s analysts do not judge there to be any material differences in the trends revealed using FE FundInfo classifications v Lipper, though there are minor points of detail that differ in individual months.
Calastone also calculates an index value to enable comparison between different asset classes and fund sectors of different sizes. A reading of 50 indicates that buy and sell orders are equal in value. A reading above 50 means capital is flowing in and a reading below 50 means it is flowing out. In other words, a net inflow of £1m would score much more highly if it is the difference between, say £10m of buys and £9m of sells than if it was the difference between £100m of buys and £99m of sells.