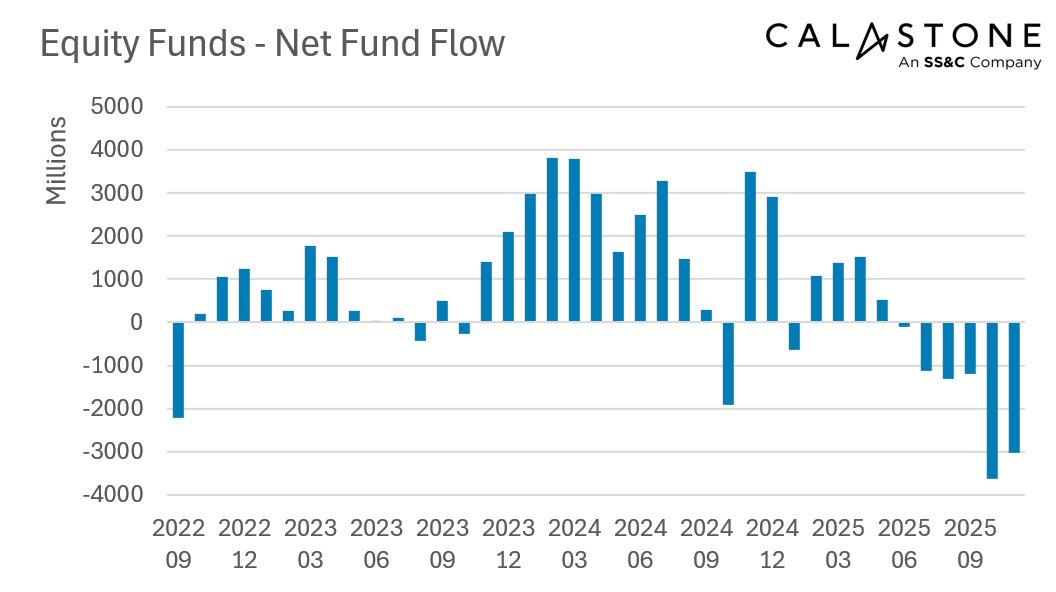
The most prolonged and most severe bout of equity-fund outflows continued unabated in November, according to the latest Fund Flow Index from Calastone, the largest global funds network. Investors pulled a net £3.02bn from equity funds during the month, the second-worst month on record. This follows October’s worst ever month for equity funds (-£3.63bn) and extends to six months an unbroken run of withdrawals.
Record-Breaking Six-Month Exodus
Between June and November, investors have now sold down £10.39bn of their equity fund holdings – making this both the longest period of selling and the most severe.
Budget Day Brings an Abrupt Reversal
Daily trading patterns showed that outflows ceased on 26th November – Budget Day. On Wednesday 26th, Thursday 27th and Friday 28th, inflows resumed. Every other day of November in the run up to Budget Day except one had seen net selling.
UK and North America Hit Hardest
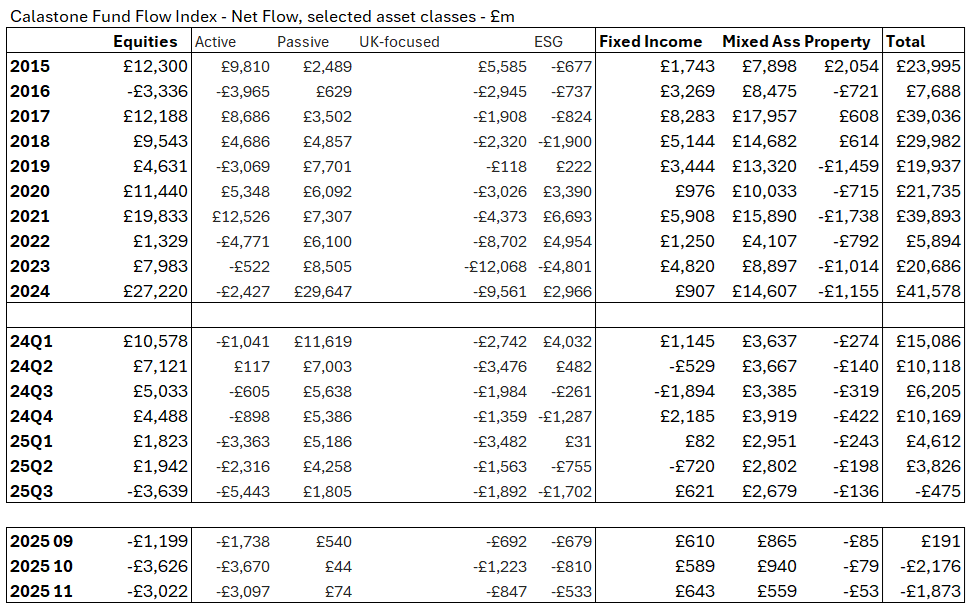
North American and UK-focused equity funds were hardest hit, the former shedding a record £812m, while the latter saw net selling of £847m. Only one month out of the last 55 has seen inflows to UK-focused funds and that followed Rachel Reeves’ first budget in 2024 when investors crystallised capital gains in the weeks running up to her expected capital gains tax raid, before recycling the cash back into funds afterwards.
Global funds, which are heavily US-weighted, were also hit hard in November in an unprecedented sixth consecutive month of selling for the sector, shedding £747m. Among all the equity-fund sectors, only Europe-focused funds saw an inflow, totalling a net £78m.
Edward Glyn, head of global markets at Calastone said: “The political narrative has played havoc with UK savers in recent months. Never have we seen such consistent or large-scale selling before. The sudden halt in equity-fund outflows that took place after the budget was delivered is clear evidence that many investors were selling their holdings as concerns rose at the possible curtailment of pension lump sum withdrawals, or of further capital gains tax hikes.
“The recent period of policy uncertainty has clearly unsettled investors and, in some cases, prompted reactive decisions they may later regret. Savers benefit most from clarity and consistency, so they can plan properly for long-term goals.”
Risk Aversion Surges Despite Market Highs
Risk aversion is also part of the story. Safe-haven money-market funds saw inflows of £1.25bn, beating the previous record set in October 2025 (£955m). In addition, inflows to fixed income funds remained elevated at £643m. Corporate and high-yield bond funds absorbed most of this capital; investors steered clear of sovereign bond funds.
Edward Glyn added: “A strong US earnings season was positively received by the markets, which were further buoyed by renewed bets on a near-term interest-rate cut. The US and global stock indices closed November near record highs. Yet investors are clearly nervous. It’s hard to disentangle Budget jitters from nerves about equity valuations, but the inflows to safe-haven money-market funds do indicate rising risk aversion.”
Methodology
Calastone’s Fund Flow Index (FFI) is the most widely followed, most timely, and most comprehensive tracker of fund flows in the UK. Because it relies on real trading data by investors, rather than survey opinion, it is also the most accurate.
The FFI analyses millions of buy and sell orders in individual funds every month from millions of UK-based investors. More than 85% of all UK fund flows by value pass across Calastone’s network. To avoid double-counting, however, the analyst team excludes funds of funds. Totals are scaled up for Calastone’s market share.
Net fund flows are the difference between the value of investor buy orders and investor sell orders. The value of buy orders and the value of sell orders are both very large – the net flow is typically very small in comparison to this large amount of trading activity.
Calastone only measures orders from UK-based investors into funds domiciled in the UK. Note that this has nothing to do with where the underlying assets are invested – a UK-domiciled fund may invest in Japanese equities, Australian fixed income, a global portfolio of mixed assets, or just UK equities. The fund sector information breaks this down in detail.
Calastone uses the FE Fundinfo dataset to assign characteristics such as fund sector, or active v passive to each fund. Before December 2024 Calastone used Lipper for this function. Calastone has restated all historic data with the new FE Fundinfo data to ensure consistency. The new FE FundInfo provides enhanced coverage, and now includes many funds that are not classified by Lipper. The new FFI is therefore even more comprehensive than before, and the historic data now reflects this improvement. Calastone’s analysts do not judge there to be any material differences in the trends revealed using FE FundInfo classifications v Lipper, though there are minor points of detail that differ in individual months.
Calastone also calculates an index value to enable comparison between different asset classes and fund sectors of different sizes. A reading of 50 indicates that buy and sell orders are equal in value. A reading above 50 means capital is flowing in and a reading below 50 means it is flowing out. In other words, a net inflow of £1m would score much more highly if it is the difference between, say £10m of buys and £9m of sells than if it was the difference between £100m of buys and £99m of sells.