


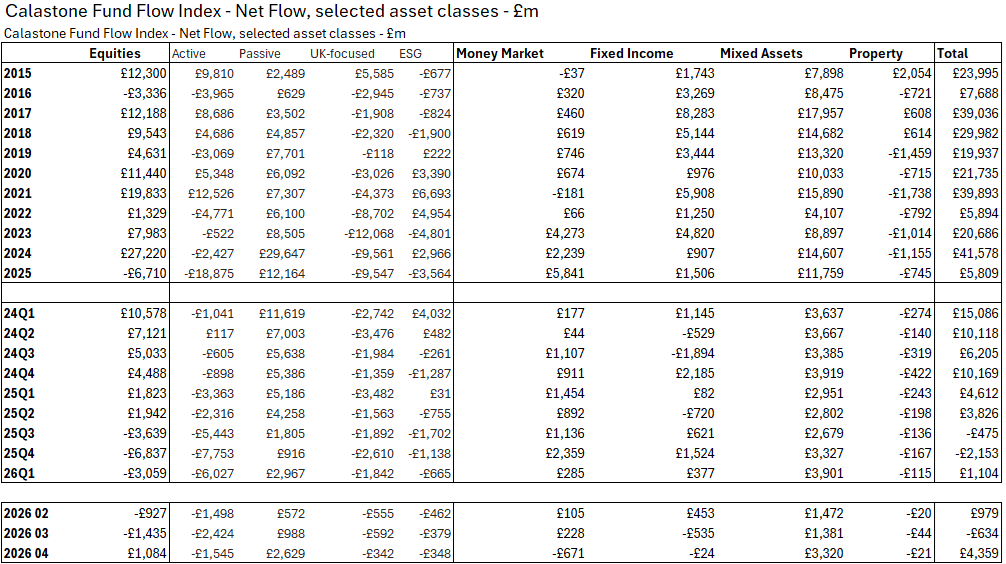
UK investors jumped back into equity funds in April after a record 10-month stint of selling, according to the latest Fund Flow Index from Calastone, the largest global funds network. They added a net £1.08bn to equity funds, making April 2026 the best month for inflows since April 2025.
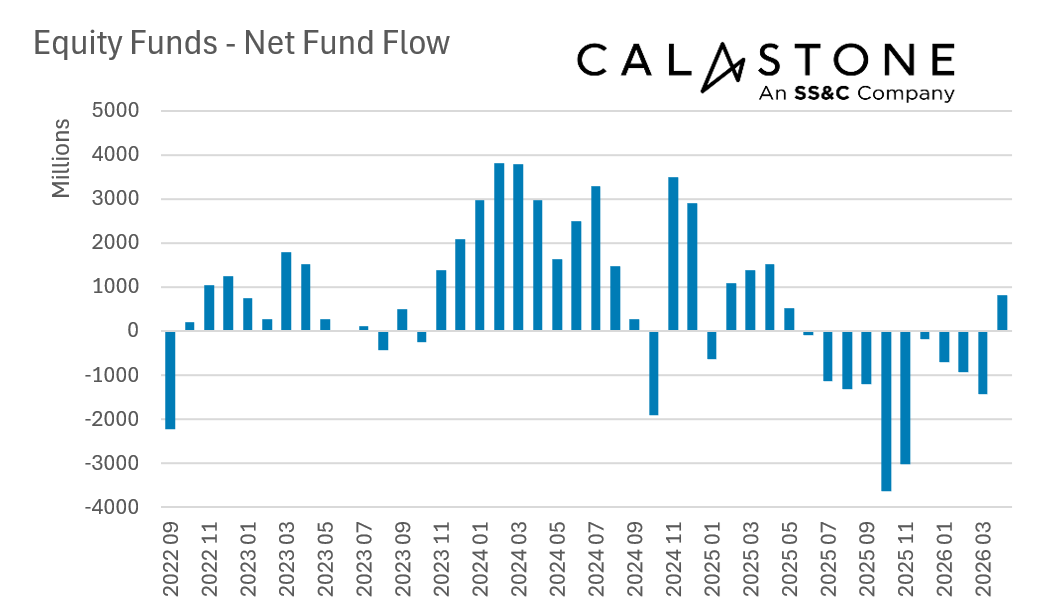
Investors were choosy. They only committed new capital to US equity and global equity funds (these are US-heavy), which saw inflows of £1.14bn and £1.33bn respectively. Every other category of equity funds saw outflows. Asia Pacific was the hardest hit, with investors pulling out £383m, while emerging markets suffered outflows of £355m. European equity funds were hit with net selling of £104m. Funds focused on UK equities also saw outflows, though at £342m, this was the best result for UK-focused funds since December 2024 when flows were distorted by the aftermath of UK budget speculation.
Index funds were the vehicle of choice for the new cash. Investors added £2.63bn to index tracking funds, but sold £1.55bn of active funds. The £4.2bn difference between the two in favour of passive funds was the third largest on Calastone’s record.
Edward Glyn, head of global markets at Calastone said: “The war in the Middle East has strangled energy and feedstock flows to large parts of the world – leaving US supplies largely intact, even if prices are higher. The expected economic fallout means that Asia and Europe – the worst affected regions – saw stock markets either flat or down during April. The gloomy outlook drove outflows from funds invested in most parts of the world.
“It was a very different picture for the US. The US market surged by almost 10% as softer data brought forward expectations for cuts from the Federal Reserve. That shift disproportionately lifted rate-sensitive tech hyperscalers, while earnings were good enough at the index level to support the move, despite remaining uneven across sectors.
“The rally still looks narrow, with a small group of large-cap names doing most of the work, but it was strong enough to pull flows back into US and global equity funds, where US exposure typically dominates.
“For momentum investors, simply buying index funds makes sense, which helps explain the particular skew to index funds in April.”
Safe-haven money market funds may have funded some of the inflows to equities in April. Investors had added £3.78bn to money market funds during the 10 months of equity outflows between June 2025 and March 2026. In April, they withdrew £671m, just as flows to equities finally turned positive.
The shake out in fixed income funds in March ceased in April – outflows were negligible at £27m as higher yields tempted new buy orders.
Methodology
Calastone’s Fund Flow Index (FFI) is the most widely followed, most timely, and most comprehensive tracker of fund flows in the UK. Because it relies on real trading data by investors, rather than survey opinion, it is also the most accurate.
The FFI analyses millions of buy and sell orders in individual funds every month from millions of UK-based investors. More than 85% of all UK fund flows by value pass across Calastone’s network. To avoid double-counting, however, the analyst team excludes funds of funds. Totals are scaled up for Calastone’s market share.
Net fund flows are the difference between the value of investor buy orders and investor sell orders. The value of buy orders and the value of sell orders are both very large – the net flow is typically very small in comparison to this large amount of trading activity.
Calastone only measures orders from UK-based investors into funds domiciled in the UK. Note that this has nothing to do with where the underlying assets are invested – a UK-domiciled fund may invest in Japanese equities, Australian fixed income, a global portfolio of mixed assets, or just UK equities. The fund sector information breaks this down in detail.
Calastone uses the FE Fundinfo dataset to assign characteristics such as fund sector, or active v passive to each fund. Before December 2024 Calastone used Lipper for this function. Calastone has restated all historic data with the new FE Fundinfo data to ensure consistency. The new FE FundInfo provides enhanced coverage, and now includes many funds that are not classified by Lipper. The new FFI is therefore even more comprehensive than before, and the historic data now reflects this improvement. Calastone’s analysts do not judge there to be any material differences in the trends revealed using FE FundInfo classifications v Lipper, though there are minor points of detail that differ in individual months.
Calastone also calculates an index value to enable comparison between different asset classes and fund sectors of different sizes. A reading of 50 indicates that buy and sell orders are equal in value. A reading above 50 means capital is flowing in and a reading below 50 means it is flowing out. In other words, a net inflow of £1m would score much more highly if it is the difference between, say £10m of buys and £9m of sells than if it was the difference between £100m of buys and £99m of sells.