
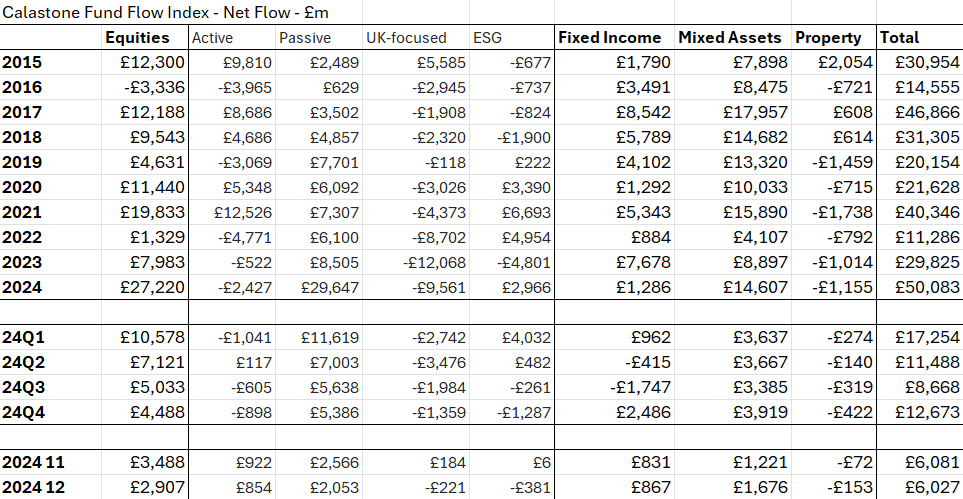
December crowned a record year for fund inflows, according to the latest Fund Flow Index from Calastone, the largest global funds network. Equity funds were the clear winners. Investors added a net £27.22bn to their holdings in 2024, easily exceeding the previous record of £19.83bn set in 2021. Moreover, seven of the best months for equity funds on Calastone’s 10-year record were also in 2024. The year finished strongly too – investors added a net £2.91bn to equity funds in December, despite volatile stock markets around the world.
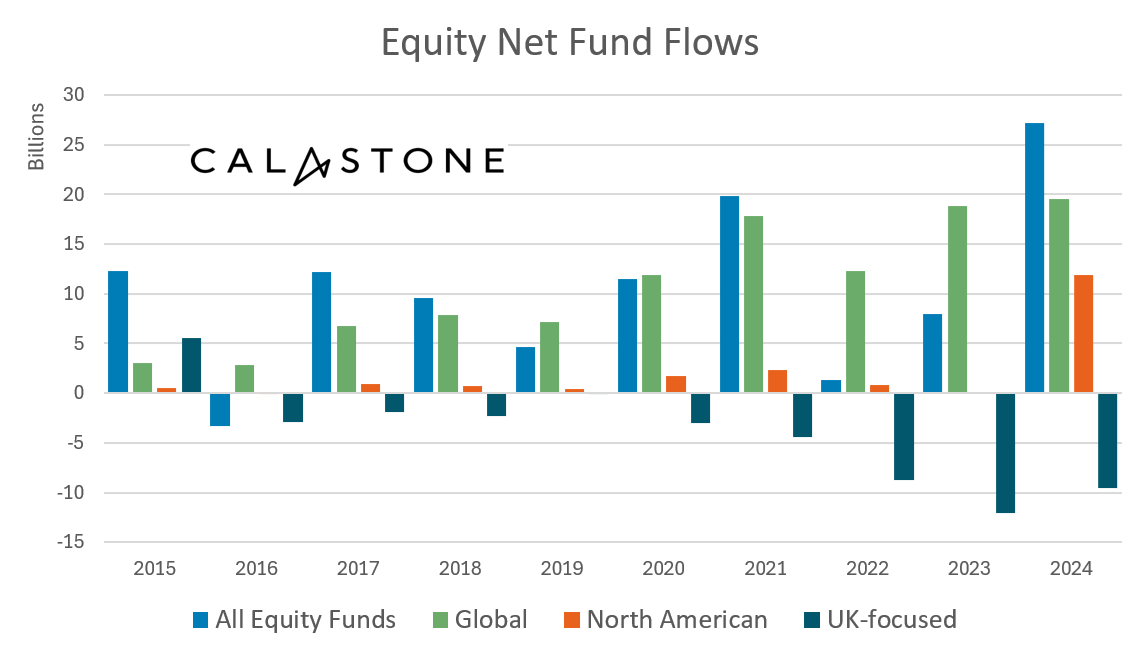
Global equity funds were the investor favourite, with £19.5bn of inflows in 2024
Global equity funds were easily the favourite fund sector for the ninth year in a row, absorbing £19.52bn of new capital, but investor sentiment changed most dramatically in favour of funds investing in North American equities. These saw net inflows of £11.90bn, up from just £5m in 2023. More than half of the inflows took place in the first quarter of 2024. The final quarter was the weakest, with inflows dwindling to £421m in December, though even this was still a strong month by the standards of the last 10 years. European equity funds also had a record year, with net inflows of £3.21bn, mostly in the first half of 2024. Emerging market funds were in vogue for 2024 too, with their second-best year on Calastone’s record.
UK-focused funds suffered a ninth year of outflows
UK-focused equity funds, by contrast, had another disappointing year. The £9.56bn outflow was smaller than in 2023 (-£12.07bn) but set against the huge inflows to equity funds overall during the year, it was the worst relative performance seen by the unloved UK-equity sector. December’s net selling of £221m was, however, the least bad outflow since May 2021 (if we disregard the small inflow in November that related to post-budget profit-taking and reinvestment).
Elsewhere, Asia-Pacific also remained out of favour, suffering the worst outflows on Calastone’s record (-£1.80bn). Funds investing in Greater China (which includes Hong Kong and Taiwan) also saw outflows. Japanese equities bucked the trend, as investors added a record £1.59bn to the sector.
Passive equity funds cornered the market
2024 was a big year for passive equity funds. Investors committed £29.65bn to the index-trackers, more than in the previous four years combined, and withdrew £2.43bn from their actively managed counterparts. The difference in investor appetite for the two strategies was easily the largest on Calastone’s record.

Weak bond markets from the summer saw inflows to fixed income funds fall sharply
Across other asset classes, inflows were more modest. Fixed income funds saw inflows plummet to £1.29bn in 2024 after moderate inflows early in the year turned to outflows during the summer as the bond market rally reversed. The resulting surge in yields (which pushes down bond prices) tempted investors back into the market in the final quarter however. Flexible bond funds, which can invest across the fixed income universe were especially unpopular, with outflows of £3.35bn over 2024. Meanwhile corporate bond funds easily garnered the largest share of new cash from investors in fixed income (+£1.99bn). High yield bond funds also did well.
Weakness in the bond markets helped money market funds – traditionally a safe-haven sector that shows minimal volatility. They had their best year on Calastone’s record, with £1.86bn of inflows. Mixed asset funds also enjoyed their best year since 2021, enjoying inflows of £14.6bn.
Edward Glyn, head of global markets at Calastone said: “Stock markets in the US and much of Europe had a terrific 2024 and this clearly tempted enormous amounts of new capital into equity funds. Global funds are dominated by US stocks already, but the additional focus specifically on that region shows that investors are doubling down on Wall Street. Purchases were very front-loaded in the year, however, and there has been greater wariness as markets have tested new highs. A correction in August and a wobbly December for global markets have reminded investors that risks abound. The bond markets are the place to look for these signals. The summer saw fears rise over government deficits and inflation; this has pushed yields in many major bond markets back towards the 15-year highs we saw at the beginning of 2023 – and bond prices lower as a result. Consequently, equities look more exposed, especially in those parts of the world where they have raced ahead.
That does not include the UK. The UK stock market badly underperformed most of its peers in 2024 and this has only intensified the extent to which UK-focused funds are being shunned by investors. The last year to see significant inflows was 2015. Since then, £45.0bn has been withdrawn from the sector. UK equity valuations are clearly cheap, but investors are capitulating, seemingly giving up hope that a long-awaited re-rating will occur.”
Methodology
Calastone’s Fund Flow Index (FFI) is the most widely followed, most timely, and most comprehensive tracker of fund flows in the UK. Because it relies on real trading data by investors, rather than survey opinion, it is also the most accurate.
The FFI analyses millions of buy and sell orders in individual funds every month from millions of UK-based investors. More than 85% of all UK fund flows by value pass across Calastone’s network. To avoid double-counting, however, the analyst team excludes funds of funds. Totals are scaled up for Calastone’s market share.
Net fund flows are the difference between the value of investor buy orders and investor sell orders. The value of buy orders and the value of sell orders are both very large – the net flow is typically very small in comparison to this large amount of trading activity.
Calastone only measures orders from UK-based investors into funds domiciled in the UK. Note that this has nothing to do with where the underlying assets are invested – a UK-domciled fund may invest in Japanese equities, Australian fixed income, a global portfolio of mixed assets, or just UK equities. The fund sector information breaks this down in detail.
Calastone uses the FE Fundinfo dataset to assign characteristics such as fund sector, or active v passive to each fund. Before December 2024 Calastone used Lipper for this function. Calastone has restated all historic data with the new FE Fundinfo data to ensure consistency. The new FE FundInfo provides enhanced coverage, and now includes many funds that are not classified by Lipper. The new FFI is therefore even more comprehensive than before, and the historic data now reflects this improvement. Calastone’s analysts do not judge there to be any material differences in the trends revealed using FE FundInfo classifications v Lipper, though there are minor points of detail that differ in individual months.
Calastone also calculates an index value to enable comparison between different asset classes and fund sectors of different sizes. A reading of 50 indicates that buy and sell orders are equal in value. A reading above 50 means capital is flowing in and a reading below 50 means it is flowing out. In other words, a net inflow of £1m would score much more highly if it is the difference between, say £10m of buys and £9m of sells than if it was the difference between £100m of buys and £99m of sells.