
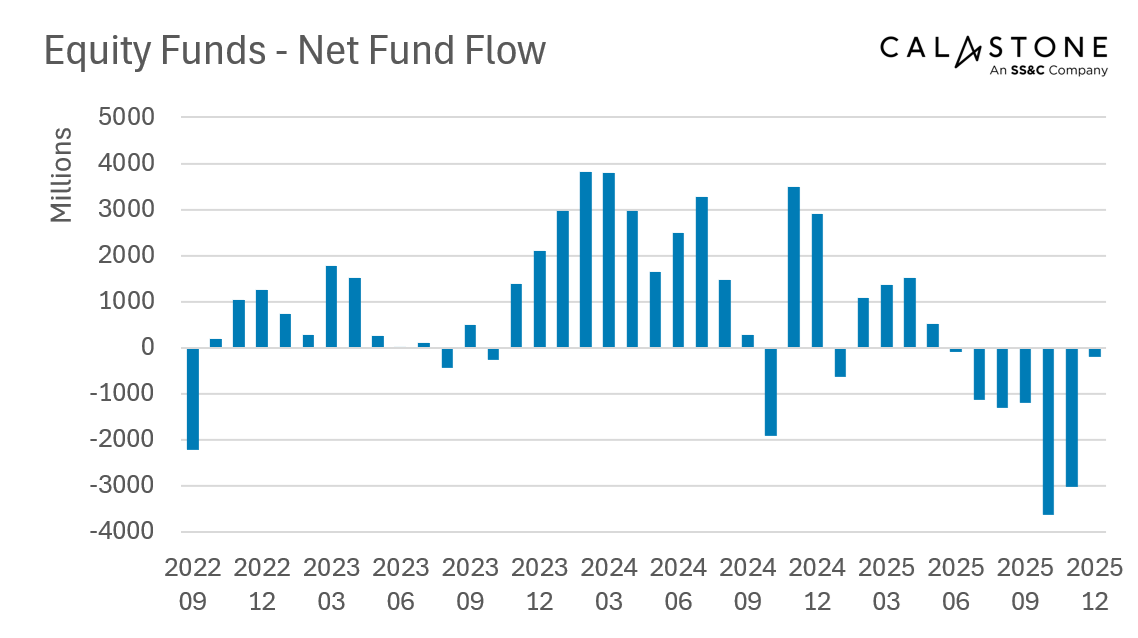
2025 saw the largest ever outflows from equity funds after December delivered an unprecedented seventh consecutive month of net selling, according to the latest Fund Flow Index from Calastone, the largest global funds network.
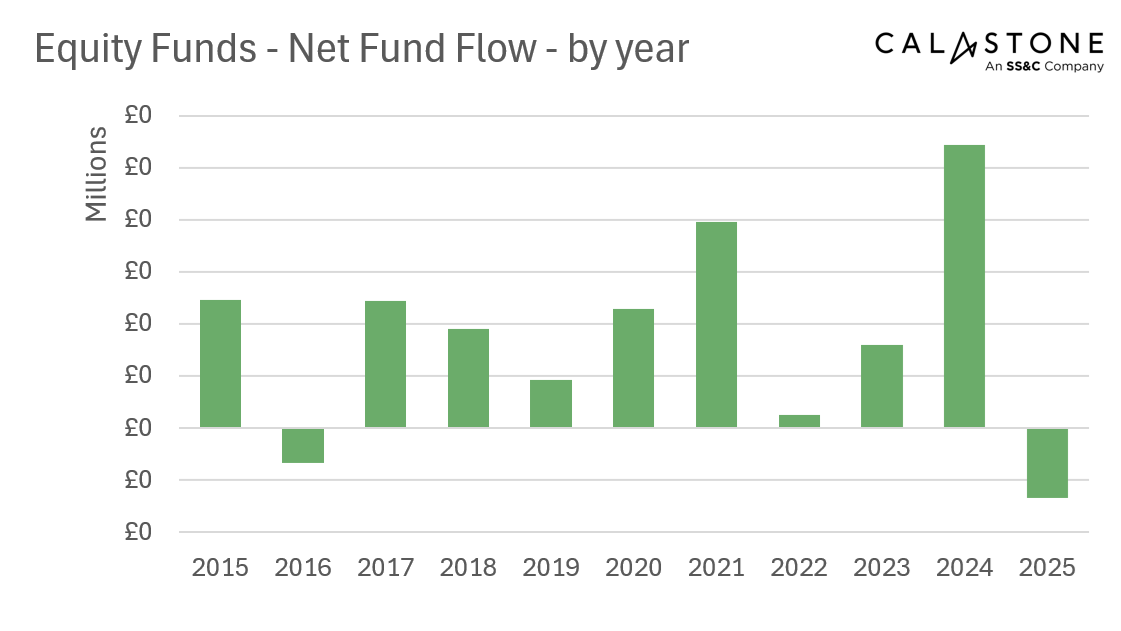
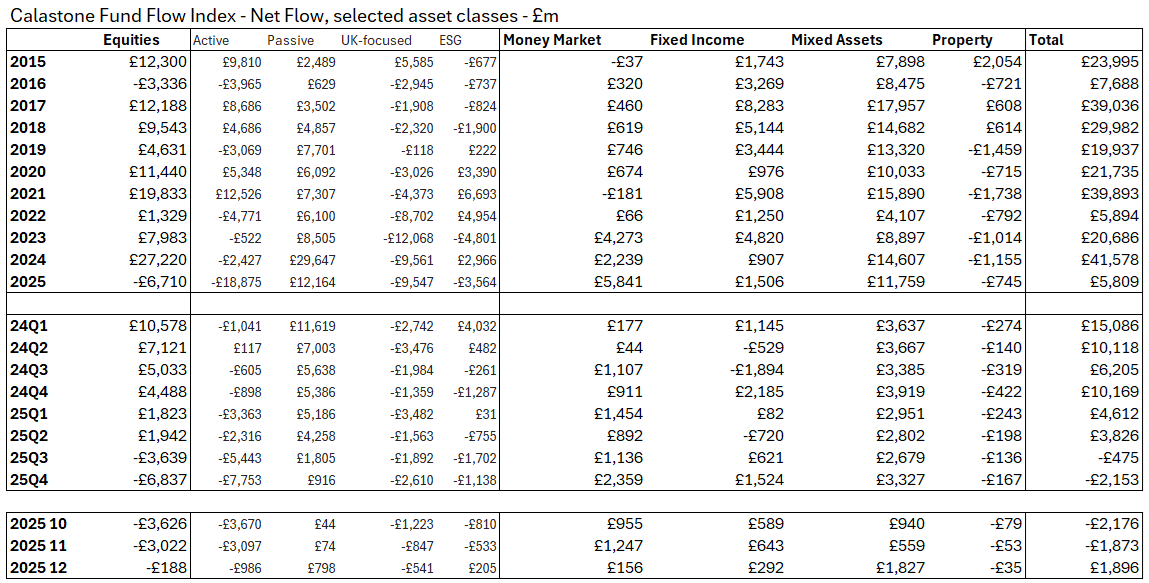
British investors withdrew a net £188m from equity funds in December taking outflows since June 2025 to a net £10.57bn in the largest and most prolonged selling spree on record. 2025 as a whole was down £6.71bn, comfortably the worst year in Calastone’s 11-year data history and more than double the previous record of -£3.34bn set in 2016, the year of the Brexit referendum.
Active funds bore the brunt of 2025’s outflows
Actively managed equity funds bore the brunt of the outflows, shedding £18.9bn of capital in 2025, compared to inflows of £12.2bn for passively managed strategies across all equity funds. Meanwhile passive global equity funds proved more popular than active ones for the first year since at least 2015.
December marked an improvement for equity funds as outflows slowed
The net £188m outflow in December was nevertheless the smallest since June – a considerable improvement on the July-November period when growing panic about a possible Budget attack on pension tax free allowances, among other measures targeting investors, led to widespread selling – October and November each saw outflows exceeding £3.0bn.
December’s improvement was notable in every equity fund sector, either via reduced net outflows or increased inflows. The biggest improvements were in North American funds, where November’s £812m outflow turned into a £107m inflow in December, and global funds, which recovered from -£747m to +£174m. Unloved UK-focused funds saw net selling shrink from £847m to £541m.
Despite UK share prices reaching all-time highs in 2025, outflows from UK-focused funds of £9.55bn almost equalled 2024’s level (£9.56bn) and marked the tenth consecutive year of withdrawals.
Record inflows to safe-haven money market funds
Other asset classes enjoyed a much stronger 2025. Diversified mixed-asset funds came out on top. They attracted a net £11.76bn, down year-on-year, but in line with their 10-year average. Meanwhile, safe-haven money market funds had a record year, absorbing a net £5.84bn of new cash. Fixed income funds saw inflows rise by half to £1.51bn though this was less than half the decade average, reflecting volatile conditions in bond markets. Each of these three asset classes also saw inflows in December.
Edward Glyn, head of global markets at Calastone said: “The sudden, dramatic slowdown in outflows between November and December is a clear indicator that months of pre-Budget speculation contributed to the record outflows from equity funds between June and Budget Day.
“But this isn’t the whole story. Record money market inflows point to investors favouring the safety of cash, suggesting they perceive equity valuations to be teetering after a dramatic 2025 bull run. Solid inflows to mixed asset funds and fixed income support the notion that risk-off is the name of the game at present.”
Methodology
Calastone’s Fund Flow Index (FFI) is the most widely followed, most timely, and most comprehensive tracker of fund flows in the UK. Because it relies on real trading data by investors, rather than survey opinion, it is also the most accurate.
The FFI analyses millions of buy and sell orders in individual funds every month from millions of UK-based investors. More than 85% of all UK fund flows by value pass across Calastone’s network. To avoid double-counting, however, the analyst team excludes funds of funds. Totals are scaled up for Calastone’s market share.
Net fund flows are the difference between the value of investor buy orders and investor sell orders. The value of buy orders and the value of sell orders are both very large – the net flow is typically very small in comparison to this large amount of trading activity.
Calastone only measures orders from UK-based investors into funds domiciled in the UK. Note that this has nothing to do with where the underlying assets are invested – a UK-domiciled fund may invest in Japanese equities, Australian fixed income, a global portfolio of mixed assets, or just UK equities. The fund sector information breaks this down in detail.
Calastone uses the FE Fundinfo dataset to assign characteristics such as fund sector, or active v passive to each fund. Before December 2024 Calastone used Lipper for this function. Calastone has restated all historic data with the new FE Fundinfo data to ensure consistency. The new FE FundInfo provides enhanced coverage, and now includes many funds that are not classified by Lipper. The new FFI is therefore even more comprehensive than before, and the historic data now reflects this improvement. Calastone’s analysts do not judge there to be any material differences in the trends revealed using FE FundInfo classifications v Lipper, though there are minor points of detail that differ in individual months.
Calastone also calculates an index value to enable comparison between different asset classes and fund sectors of different sizes. A reading of 50 indicates that buy and sell orders are equal in value. A reading above 50 means capital is flowing in and a reading below 50 means it is flowing out. In other words, a net inflow of £1m would score much more highly if it is the difference between, say £10m of buys and £9m of sells than if it was the difference between £100m of buys and £99m of sells.