
Fund inflows recovered in January, after December saw the worst reading in two years, according to the latest Fund Flow Index (FFI) from Calastone, the largest global funds transaction network. But there was little evidence that the more positive figures represented a sea change in investor sentiment.
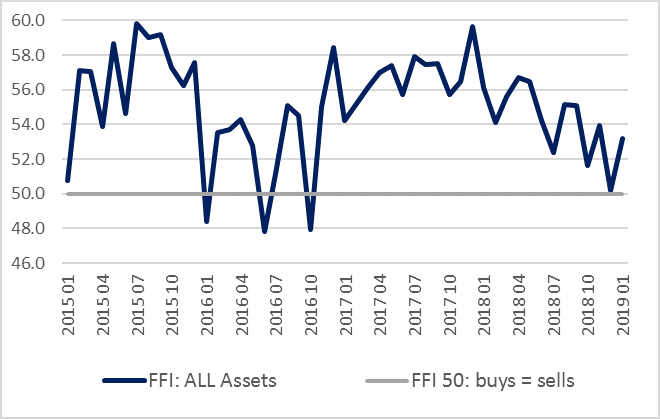
The Fund Flow Index rose to 53.2 (50 indicates that inflows of capital equal outflows), but this was below the long-run average, and largely dependent on investors buying mixed asset funds. Other asset classes were either broadly neutral or witnessed outright outflows. The net value flowing into UK funds was £1.7bn in January, one third lower than the long-run average. Calastone’s monthly index tracks orders representing millions of individual investor decisions and is the most comprehensive and up-to-date measure of UK fund flows (see methodology).
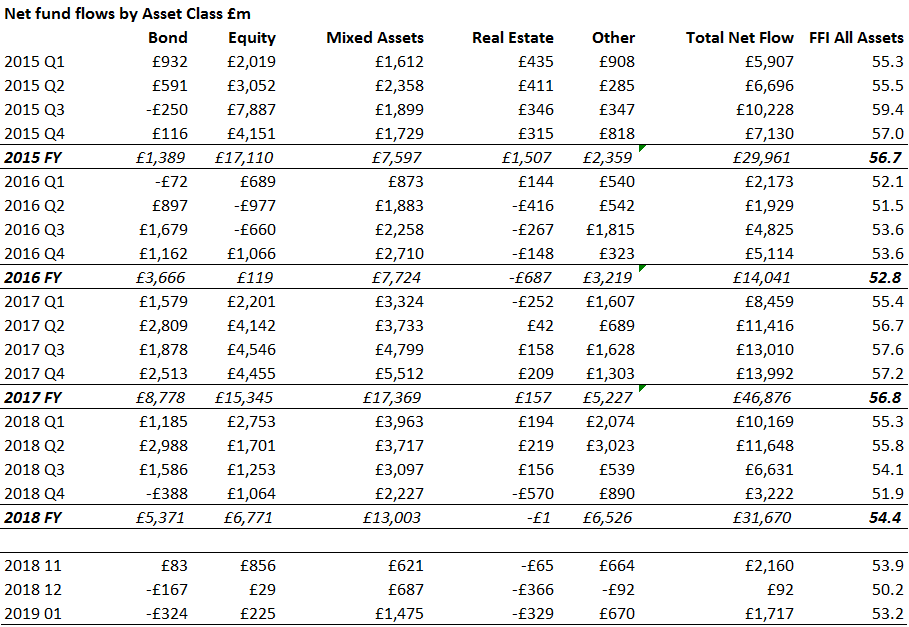
Chart: Calastone Fund Flows Index (All Assets)
Mixed asset funds accounted for nine tenths of net fund inflows in January, recouping some of the reduction in demand for them in recent months. Because they feature so prominently in regular savings plans, they are the asset class that typically sees the least flow variability from month to month by quite a large margin. In fact, there has only been one month in at least the last four years where they have seen net outflows, and even then it was vanishingly small. This makes mixed asset funds poor barometers of investor confidence.
Other asset classes showed that investors are reluctant to commit new capital to the market, or are redeeming units in their fund holdings.
Chart: FFI Real Estate
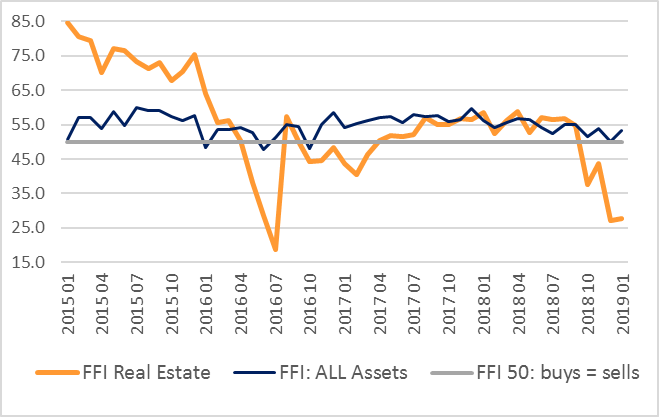
Property funds saw their fourth consecutive monthly outflow as another £329m left the market, taking net redemptions since October 2018 to £899m. The FFI Real Estate languished at 27.6, its third lowest reading on record for the Calastone index. Fixed income funds are having their worst run since 2015 with outflows in three of the last four months: £324m flowed out in January, leaving the FFI Bonds at 46.0.
Equity inflows of £225m were just one quarter of the long-run monthly average, even though overall volumes of two-way trade were roughly in line with normal activity. As a result, the FFI Equity registered 50.9, only a little above the neutral 50 mark. Busy trading activity, but little new money being committed, suggests investors were more prepared to switch between funds than to add to their holdings.
Chart: FFI Equity: UK, Global, Europe
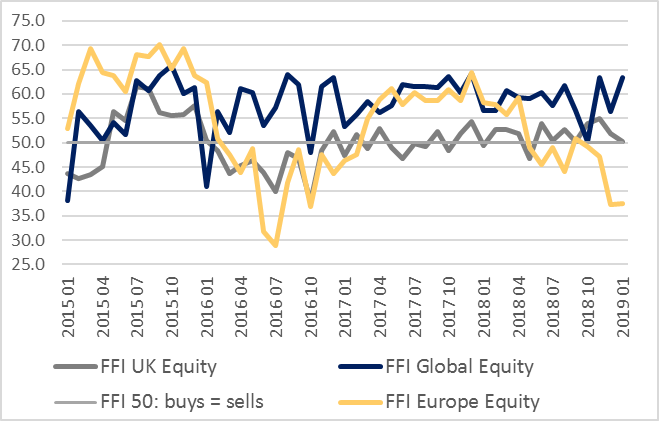
The weakest were European equity funds, which saw their largest net outflow since the aftermath of the Brexit referendum. Equity income funds saw their 20th consecutive month of outflows, although the rate of redemptions has slowed markedly in the last four months. North American equities saw modest outflows too, while fund flows to Asia remained at two-year lows.
UK equities saw a tiny £14m of inflows, despite being the largest category of funds under management, registering a neutral FFI of 50.3. Cash flowed out of UK equity funds on the days immediately before and after Theresa May’s historic defeat on her Brexit agreement, but the biggest net selling day of the month took place when she doubled down on her red lines a week later.
In the equity asset class, the big winners in January were global funds. £651m flowed in, bucking the trend in other equity fund categories and registering a very strong FFI of 63.3. Global funds are the only category of equity fund not to have seen any month with net outflows in the last three years.
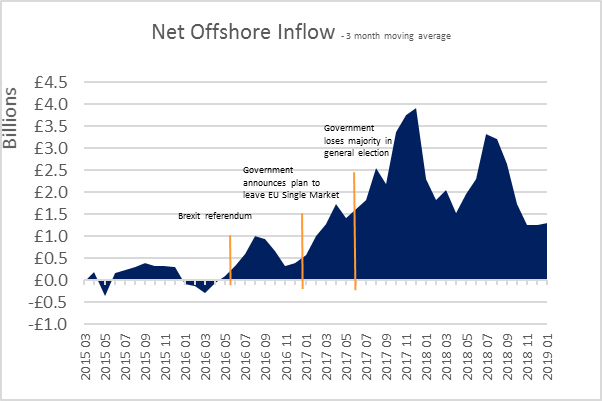
Net flows of UK capital into funds domiciled offshore continued their unbroken run since the UK’s Brexit referendum campaign kicked off in the spring of 2016. A cumulative net £57bn has flowed into funds that lie outside the UK’s regulatory jurisdiction since April 2016. Before that time, inflows roughly balanced outflows. In January, net inflows to offshore funds were positive in every asset class except money market funds, which typically show more volatility among the institutional and high net worth individuals who are more prone to using offshore vehicles for their capital. Offshore investors were significantly more positive on equities in January than those in UK-domiciled funds, but only took an interest in global and emerging market funds. They redeemed holdings in other equity categories, selling UK funds for the sixth consecutive month. They were also particularly large sellers of European equity funds.
Chart: Value of funds flowing offshore
Edward Glyn, Calastone’s Head of Global Markets, comments: “Fund flows were certainly better in January than in December, but the figures were in truth weaker than they appear at first glance, and the trend is still downwards.
Uncertainty over economic prospects and geopolitical events is clearly discouraging investors from committing new capital to funds, but the extreme financial market volatility that also results from this uncertainty has its own deterrent effect.
Brexit also casts a dark cloud. Since the Brexit referendum, no net new money has been committed to UK equity funds, despite UK equities being by far the largest investment fund category in the UK funds market, easily the largest category, while property funds are enduring intensifying capital flight. Unprecedented volumes of capital have also fled offshore rather than face the uncertain regulatory environment in the UK after the 29th of March. European equity funds are also contending with a recession in Italy, and a sharp slowdown elsewhere.
Structurally, fund flows are positive, given the need for households to build savings over time, but at present our index shows a clear nervousness about timing new investment.”
Methodology
Calastone analysed over a million buy and sell orders every month from January 2015, tracking monies from IFAs, platforms and institutions as they flow into and out of investment funds. Data is collected until the close of business on the last day of each month. A single order is usually the aggregated value of a number of trades from underlying investors passed for example from a platform via Calastone to the fund manager. In reality, therefore, the index is analysing the impact of many millions of investor decisions each month.
More than two thirds of UK fund flows by value pass across the Calastone network each month. All these trades are included in the FFI. To avoid double-counting, however, the team has excluded deals that represent transactions where funds of funds are buying those funds that comprise the portfolio. Totals are scaled up for Calastone’s market share.
A reading of 50 indicates that new money investors put into funds equals the value of redemptions (or sales) from funds. A reading of 100 would mean all activity was buying; a reading of 0 would mean all activity was selling. In other words, £1m of net inflows will score more highly if there is no selling activity, than it would if £1m was merely a small difference between a large amount of buying and a similarly large amount of selling.
Calastone’s main FFI All Assets considers transactions only by UK-based investors, placing orders for funds domiciled in the UK. The majority of this capital is from retail investors. Calastone also measures the flow of funds from UK-based investors to offshore-domiciled funds. Most of these are domiciled in Ireland and Luxembourg. This is overwhelmingly capital from institutions; the larger size of retail transactions in offshore funds suggests the underlying investors are higher net worth individuals.