
Since January 2019, Calastone has handled $5.9 trillion of fund transactions, $1.3 trillion of this in 2023 alone, excluding institutional money market funds.
For asset managers, understanding what investors want to own and how they behave is a crucial aid to the development of new products and the effective marketing of the funds already being managed. Calastone sits right at the heart of the system, handling tens of millions of transactions every month. Our data provides a unique insight on how funds are flowing, right down to asset level on a daily basis. That means we can see the big long-term trends in investor behaviour, the medium-term fluctuations that take place across an economic or market cycle, and the immediate response investors make to newsflow on a daily basis. Calastone’s network is growing rapidly, adding new territories all the time. Our international perspective means we can measure the extent to which a trend reflects local factors or is part of a wider global movement.
For investors, knowing what everyone else is up to can be helpful too. Should I plough my own furrow or sit and wait?
Fund Values
Trading Volumes
Net Fund Flows
Fixed Income
Equities
Active v Index
ESG Backlash
Viewpoint
Mutual funds recouped all 2022’s lost assets under management in 2023
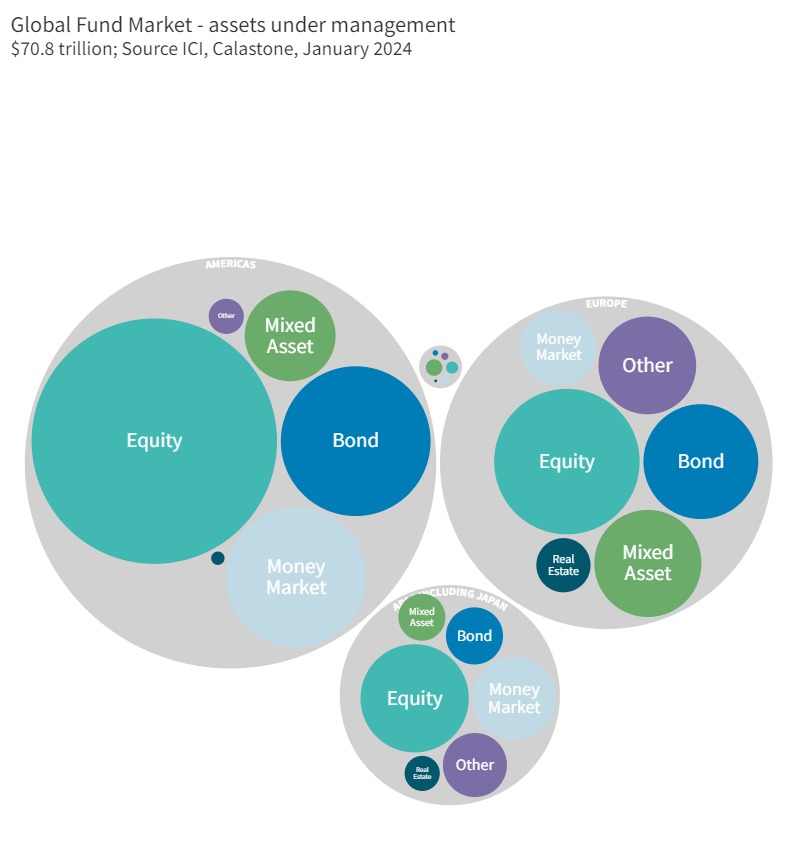
Despite an uncomfortable detour between August and October, the sharp recovery in global equity markets in 2023 pushed the value of mutual fund assets under management a record $10.7 trillion to $70.9 trillion[1]. The one sixth increase meant they exactly recovered what they lost in 2022’s bear market, and therefore equalled their previous record at the end of 2021. Around one fifth of the increase was down to net inflows, driven mainly by US investors[2], but most of the improvement reflected simple asset price movements. This is supported by Calastone’s own data across our global network. Fund flows for the year showed that it was a good year for fixed income, a bad year for equities (though better than 2022) and a subdued year for mixed-asset funds.
Over the last year, the biggest recovery has been in the US where assets have jumped by 21%, reflecting the greater exposure of US investors to their strongly-performing domestic market. Across Europe, mutual fund values are 16% higher and 14% in the UK.
Weaker Asian exchange rates mean fund assets across the region rose more slowly in US dollar terms – up 12% – but that same currency weakness means local investors would have felt this differently. Mutual fund assets in Australia and China jumped by 18% in local currency terms, while those in Japan soared by more than a quarter.
[1] Source, ICI Global Q3 2023 figures adjusted for Q4 market movements
[2] Source: ICI global
2023 saw very active trading volumes, up by one tenth year-on-year
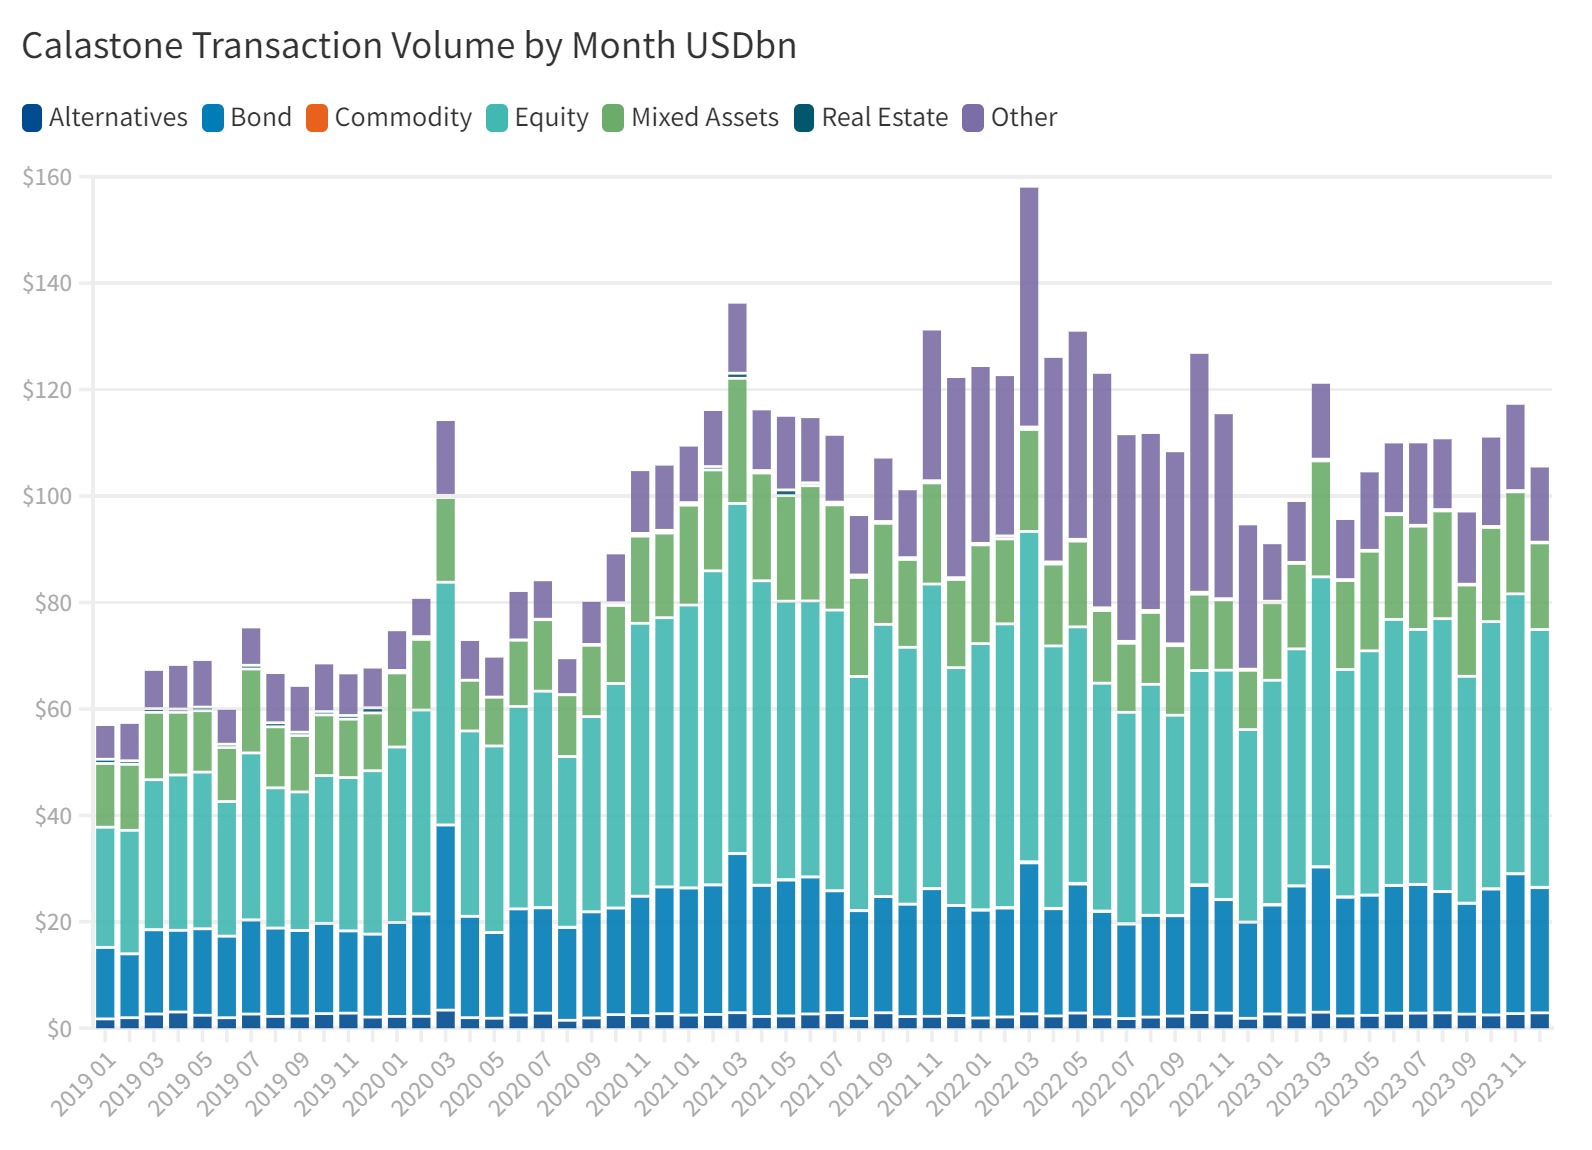
The volume of funds traded is a function both of asset values in general and of decisions by investors to add to their holdings or withdraw capital. Investors were very active in 2023, trading $1.07 trillion across the three big asset classes of equities, fixed income and mixed assets, an increase of 10.0% compared to 2022. Equity funds accounted for over half the total volume with bonds and mixed assets at just over a quarter and a fifth respectively. Bond market values were lower in 2023 on average than 2022, while the average value of equity markets was roughly the same year-on-year, though they saw a lot less volatility than in 2022. The contribution asset prices made to total volumes in 2023 was therefore mildly negative. Growth in underlying investor trading activity was consequentially higher than the simple value comparison suggests.

Volatile markets usually deter fund transactions
We tend to see trading volumes decrease in times of significant market volatility and negative sentiment. This might sound counterintuitive – it is easy to imagine that volatility breeds activity. In 2022, for example, the bear market in both stocks and bonds caused volumes to fall by one eighth and one seventh respectively. In years when markets are strong, we see volumes rise significantly – as 2021’s figures show.
In 2023, equity market volumes were slightly ahead year-on-year, picking up more strongly as market confidence improved towards the end of the year. The upset in the bond markets between August and October this year depressed volumes for a time, but overall, the bond markets were less volatile than in 2022, and performed better too: this meant volumes were higher – up 11.9% to $282bn.
Across Calastone’s territories around the world, we saw volumes of bond transactions rise most strongly in Hong Kong, Europe and Taiwan, with more modest increases in the UK and Australia; they were roughly flat in Singapore. Equity funds rose relatively slowly in most parts of our network – between 4% and 6% – except in Singapore and Taiwan where they fell.
Activity in money market funds reached a record level as investors chased the high yields and low volatility these instruments offer, particularly given how slow banks have been to raise deposit interest rates.
Property is ill-suited to open-ended funds and is falling out of favour
Mixed asset funds mainly comprise equities and bonds, so they tend to follow the wider market trends. Among other asset classes, property funds have seen investors lose interest in recent years – their open-ended structure makes them unsuited for illiquid property investment while the economic and interest-rate environment has diminished the attractiveness of the asset class. Elsewhere, alternatives, a fund asset class mainly comprised of hedge funds, saw volumes rise. But despite reports in the media that investors have become more positive on hedge funds, which should indeed do better now that markets are no longer becalmed by years of near-zero interest rates, our data shows that investors increasingly want to exit this more esoteric asset class.
Fund transaction volumes are not two-way trades like tradable securities
Trading volumes in funds are not the same as in underlying assets on capital markets. For every buy order in, say, China Mobile shares that is executed on an exchange, there has to be a matching sell order from another investor. This is not the case with funds. A surplus of buy orders means more units are created, funnelling cash to a portfolio manager to buy assets. Unlike stocks and bonds, that means volumes of fund units can rise because of increased buying pressure alone or because of selling pressure, or a combination both.
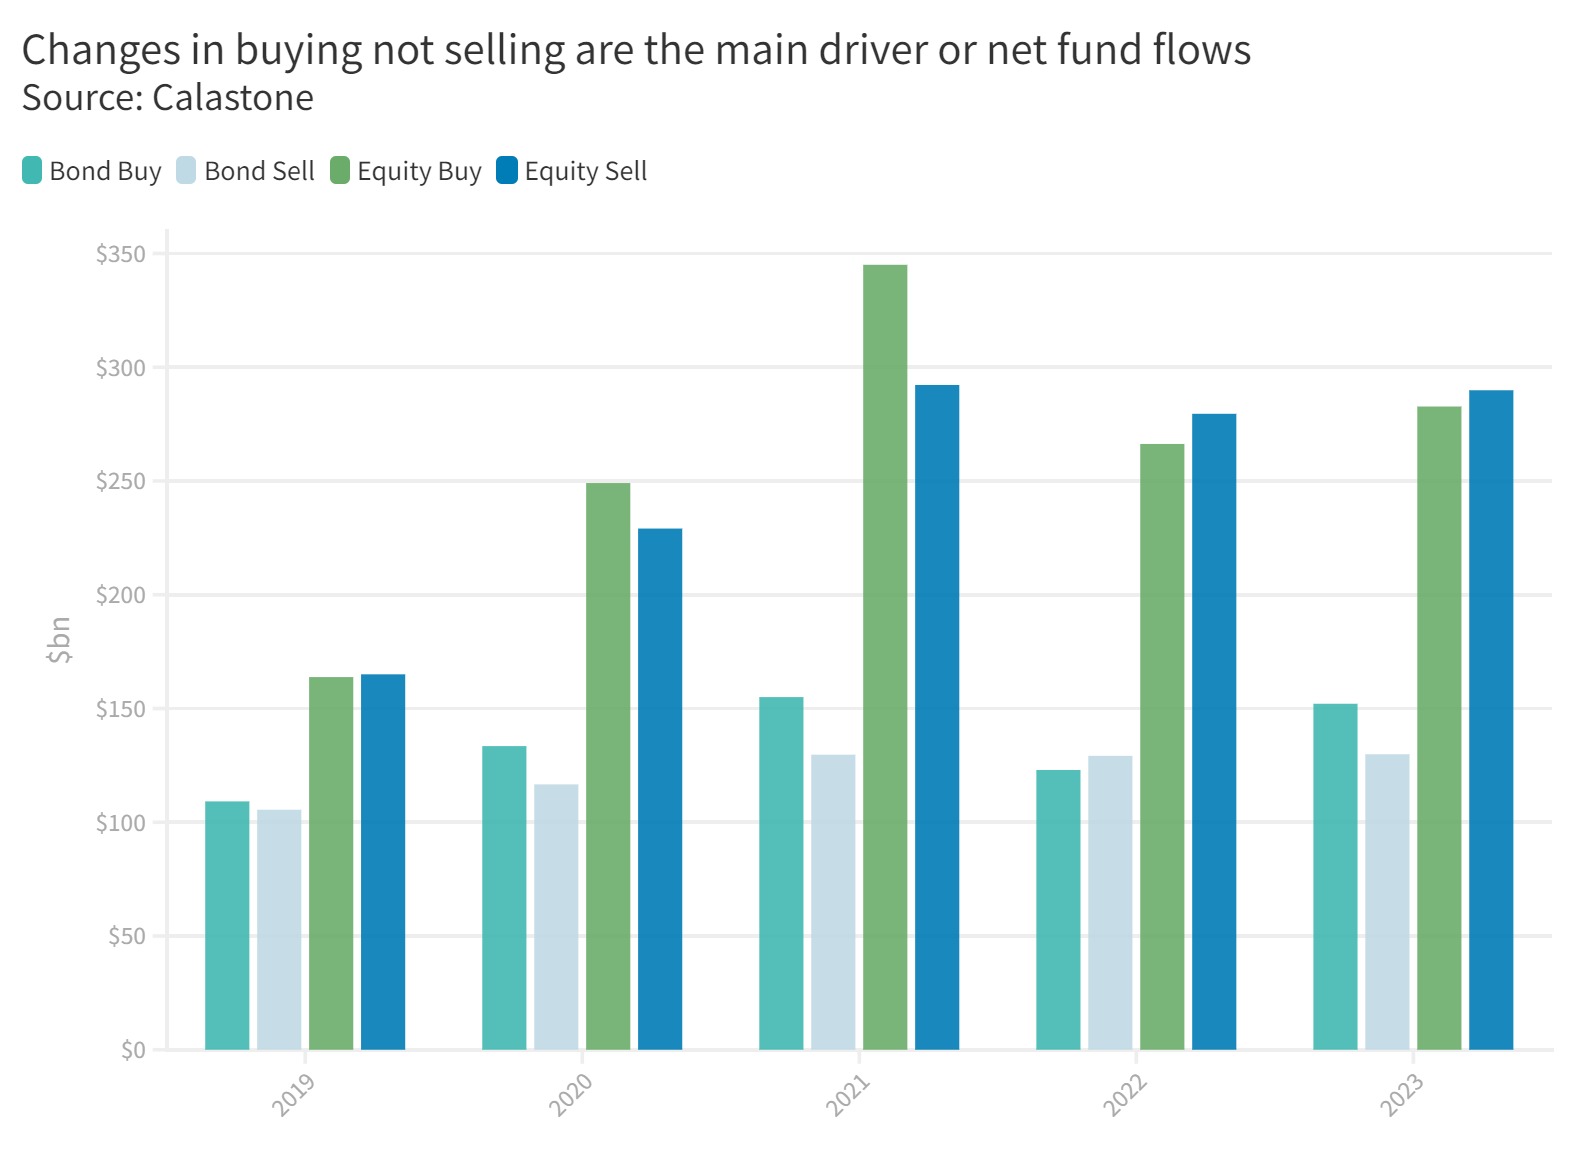
Calastone’s fund flow data clearly shows that changes in buying activity rather than selling are the key driver of volumes in the short term.
Net fund flows are driven more by changes in appetite to buy rather than sell
As the key driver of transaction volumes, it follows that changes in appetite to buy also largely determine net fund flows. Of course, over the medium and long term there is a structural bias towards inflows, at least while most economies are still in the saving and wealth accumulation phase. But in the short term, when market conditions are weak, buyers tend to go on strike. Even if there is little or no change in selling activity, that can quickly turn net fund flows negative. This is chiefly because net fund flows are the wafer-thin difference between large volumes of buy and sell orders. For example, we have processed over $2.6 trillion of equity fund trades in the last five years alone – but the net fund inflow in that time has been just $51bn, under 2% of the total transacted.
In 2022, when the global bear market began to bite, sell orders did not rise as one might reasonably expect, yet there were nevertheless significant outflows of capital from equity funds ($13.3bn) – following especially strong inflows in 2021. In fact, the value of sell orders in equity funds fell by 4.3%, or $12.7bn compared to 2021, but the value of buy orders fell even more – down by 23% or $78.7bn. Some of this reflected lower asset values of course, but the primary driver was order volume.
The pattern repeated in 2023, but less starkly – the value of buy orders rose 6.2% while net selling rose by 3.7% – the result was a reduction in outflows to $7.1bn. Over the long term, the monthly fluctuations in buy orders are two fifths greater than the fluctuations in sell orders[3]. This same behaviour is apparent across all our territories.
We see it in other asset classes too. Fixed income funds were in favour for most of 2023, after a difficult year in 2022 when the bear market drove significant outflows. But those outflows took place entirely because buying fell away – down by a fifth in 2022; the value of sell orders was almost exactly flat year-on-year.
In 2023, by contrast, we saw strong net inflows to bond funds once again, particularly in the first half of the year, before the bond markets began to weaken between August and October. Inflows of $22.2bn in 2023 were driven by a sharp one quarter increase in the value of buy orders, accompanied by a second consecutive year where selling activity was almost exactly flat.


[3] Comparing variance

Bond markets held the key to all asset prices in 2023
The bond markets have been hard to navigate. After a good start to the year, bonds weakened in the third quarter as economic resilience and sticky inflation pushed up expectations for rate hikes and pushed out the time horizon for eventual cuts, leading to higher market yields. On top of that the so-called term premium rose significantly. This premium compensates investors for dangers that lurk in the future – the further out you look, the less certain you can be. Investors began to demand a bumper payday in yield terms for the risk that inflation might be higher than expected, or interest rates may fluctuate more, or even that a government as big as the US might default – with the economy running hot and the fiscal deficit at 7.5% this year, that is not the outlandish prospect it was once considered to be.
Bond markets saw strong gains towards the end of the year after a turbulent few months
This turbulence was not great for returns in much of the second half of 2023 – at least until mid-October – but investors have been understandably tempted by both higher yields and the prospect of capital gains when inflation is defeated and yields subside (yields move opposite to prices). This has already begun. A market rally that began in late October is already generating significant gains for investors who were brave in the turbulent weeks that went before. For example, the US ten-year benchmark bond yield blew out to almost 5% in October before rallying strongly to end the year down at 3.9%.
Investors are keen to lock into high yields
After the bear market of 2022 that saw a very large fall in bond prices as the end of the zero-interest rate era transitioned to the higher rate environment of old, a big change in appetite to own fixed income funds is now apparent everywhere. Asian investors have shown the biggest reversal of sentiment – buyers across the region switched from strong net selling in 2022 (-$7.3bn) to strong net buying of $9.4bn in 2023. Investors in Hong Kong almost reversed all outflows they made in 2022, while those in Singapore and Taiwan ploughed back more money than they had withdrawn the year before. In Australia, net buying quintupled year-on-year to $3.1bn, and it more than doubled in the UK, from $4.4bn to $10.5bn. Clearly those higher yields are proving irresistible. Even in Europe, where sentiment towards all manner of asset classes was negative in 2023, net outflows from bonds funds fell from $2.8bn to just $275m.

Investors withdrew capital from equity funds in 2023, and were especially negative from May onwards
2023’s outflow of $7.1bn from equity funds was significantly better than the $13.3bn of redemptions in 2022, but we still saw outflows. Two years of net selling is certainly unusual. In the UK, where we have a longer history of data, we have never seen two negative consecutive years since we began compiling figures in 2015. Despite global equity markets doing well in the first seven months of 2023, investors only added funds cautiously between January and April, before becoming net sellers for the rest of the year, with the exception of a small flurry of optimism in November. Even strong markets in December were not able to tempt inflows.
UK and European investors were the most negative in 2023
If we look across our different territories, investors in the UK and Europe have been the most negative, though the outflows were significantly smaller year-on-year. We saw net outflows from equity funds on our network of $1.8bn in the UK (one fifth of the level the year before) and of $1.6bn in Europe, (one sixth of the level in 2022). Our business is not the same size in each place, however, so a glance at our Fund Flow Index (FFI) is helpful for comparison. This compares net fund flows to total volumes and showed a very similar 49.7 and 49.4 respectively for 2023, just below the neutral 50 mark where buy and sell orders are of equal value. European investors were far more negative in 2022, so sentiment here has improved more than in the UK.
Outflows from equity funds across Asia were more modest
Across Asia, we saw very modest outflows in Singapore (-$376m) that almost exactly matched a similar inflow the year before. With an FFI reading of 48.3 it was the weakest year for equity fund investors in Singapore on our 5-year record. Taiwanese investors were more pessimistic and pulled $806m of capital from equity funds on our network on lower trading volumes – this generated a FFI reading of 45.1, the weakest of all our major territories. 2023 was the first year on Calastone’s record that Australian investors were net sellers of equity funds, withdrawing a modest $724m of capital, with a FFI of 49.4, in line with Europe and the UK and better than some of their Asian neighbours – Australians were net sellers in six of the last twelve months. Hong Kong investors were much more optimistic, the only one of our major territories to see equity fund inflows in 2023. After a weak start to the year that reflected the stuttering reopening of the Chinese economy, they were net buyers for most of the rest of 2023, adding $1.6bn and generating a very positive FFI of 53.5.
Passive funds back in fashion

Notably, index tracking funds were strongly back in favour in 2023. They attracted inflows of $20.1bn, while active funds shed $27.2bn. In 2022, both strategies saw outflows, though active funds suffered more, while 2021 was a rare year in which active funds did significantly better – inflows of $40.3bn were more than three times larger than for passive funds. Over the last five years, passive funds are easily ahead. Investors have bought a net $53bn of passive funds, and just $1.7bn of active ones.

ESG backlash drives investors out of ESG funds
2023 marked a profound change in investor’s attitude to ESG investments. During the three-year boom from 2020-2022, investors across all our territories added $51.2bn to equity funds with an ESG label. About 80% of this was actively managed and proved a boon for active fund managers, offsetting outflows from traditional actively managed funds by a factor of three to one. Astonishingly, the $51.2bn added to ESG equity funds was more than 6x the amount of capital invested committed to equity funds without specific ESG commitments over the same period.
Non-ESG equity funds enjoyed inflows in 2023
In 2023, investors across our global network withdrew $10.2bn from ESG equity funds – and we saw the same pattern in every one of our territories. Indeed, if we exclude ESG funds, then overall equity fund flows would have been positive in 2023 to the tune of $3.0bn – a modest amount, certainly, but the clear distinction between ESG and non-ESG and the sudden change in behaviour are startling.
The great ESG backlash reflects accusations of greenwashing and an increasing realisation that ESG is simply too vague to meet investor concerns. For example, a Japanese car manufacturer that has improved its governance standards – governance in Japan is a bugbear for international investors – might qualify for an ESG fund. But an investor might imagine that she is choosing ESG funds to match her environmental values and so would be disappointed to find she owns a lot of legacy industries like car makers doing not very much differently at all. Whether it’s because people don’t really believe companies are walking the ESG walk, or are losing faith in the fund management industry’s ability to effectively differentiate between companies that meet the highest standards and those that do not, there has been a clear break in the trend – 2023 is the first year since at least 2019 that non-ESG equity funds have attracted more capital than ESG.
European investors turned away from ESG first, but we now see the trend across our global network
European investors were the first to turn away from the sector. They began selling out of ESG funds in January 2022 and did so consistently almost all of that year. Part of this simply reflected bearishness on equities across the board, but selling of ESG holdings was disproportionately high and illustrates how the backlash was setting in. In 2023 they were net sellers in every month from May to the end of the year, withdrawing a net $3.7bn. Singaporeans were close behind. They were also net sellers in 2022, even as they continued to add to non-ESG funds. In 2023 outflows in Singapore more than doubled to $712m, and more than offset inflows to traditional equity fund options.
Elsewhere, UK investors sold down $1.2bn of their holdings in 2023, almost double their redemptions from non-ESG equity funds. Australians followed suit with $292m of redemptions from ESG funds, and $425m redemptions from non-ESG. In both cases, the far smaller size of ESG funds by assets under management compared to non-ESG funds demonstrates that this indicated a more determined focus on selling the former. Hong Kong and Taiwanese investors joined their peers around the world, pulling of capital $370m and $552m respectively from ESG equities.
Regulators recognise the need for change
Regulators and the funds industry recognise there is work to do. In the UK, labelling is set to become much stricter, for example. But the bigger issue is really about what ESG means in the first place. The industry will have to work harder to communicate with its customers if it wants to build trust in the category.
Property – an unpopular asset when interest rates are high
Property funds had another difficult year in 2023. Across Calastone’s global network, they shed $629m of capital, the fifth consecutive year that we have seen cash leave the sector. Outflows have totalled $6.5bn since 2019.
The worst year for the sector was 2021, when investors recognised that commercial property occupancy trends had likely changed permanently as working patterns adopted during the pandemic ossified into a new normal, affecting offices, retail and distribution in particular. Thereafter, the relentless climb in interest rates around the world from the beginning of 2022 has meant that investors have no longer had to look much beyond cash if they want an income, while higher long-term interest rates have impacted asset values. Equally, a weaker economy is bad news for the property sector too as it suppresses rental demand. Some of our territories do not have dedicated open-ended property funds, or these are sometimes subsumed in wider equity categories, but where the sector is more discretely defined, such as in Europe, the UK and Australia, we have seen consistent outflows.
Europeans and Taiwanese remained positive on mixed assets elsewhere investors are turning away
Mixed asset funds saw a significant divergence in popularity in 2023. European investors stood out by committing a record net $13.0bn to the sector. Most of the buying activity originated in Luxembourg, the home of European fund management, so it may reflect asset allocation changes among wholesale investors, but beyond that, we noticed particular appetite among savers in Switzerland to add to their holdings. There were also significant inflows in Taiwan (though at half the pace of 2021 and 2022). But everywhere else across our network, we saw investors withdrawing capital. The objective with mixed asset funds is to exploit the traditional inverse correlation between equities and bonds to generate better risk-adjusted returns. The problem is that bond and equity markets have moved largely in tandem in the last eighteen months or so which is leading investors in many parts of the world to question whether they can do better elsewhere for a similar risk profile. This reappraisal is clearly driving investors out the doors.

In the UK and Australia the majority of business is transacted locally, but outside those territories, most of the trades we settle cross international borders. Our international network is a big plus for platforms and fund managers because it means a wider product reach – that in turn means better choice for investors, not just in the product itself but also in terms of a favoured jurisdiction for their capital.
Global stock markets are flirting with the record highs they saw back in 2021 and bond markets have recovered strongly from their Q3 lows, as investors increasingly judge that disinflation is now well entrenched in most major economies. Markets are now discounting a series of interest rate cuts from the world’s major central banks this year.
There is considerable uncertainty about the outlook for global economic growth, resulting in a wide range of forecasts from economists. The global economy held up much better in 2023 than many feared, however, and it may well do so again this year. Nevertheless, geopolitical concerns muddy the waters, the global trade disruption in the Red Sea may scupper hopes that inflation is vanquished, and the large number of elections around the world will make it harder for governments to tame their urge to binge on borrowing.
Portfolio managers of course grapple with these matters every day, but there is more to the fund management industry’s profitability (and the returns it offers investors) than just worrying about asset prices. Our figures show that passive funds are once again in the ascendancy, bringing ever more pressure on fees. As demographics evolve, investors have very different expectations of how they want to interact with those providers of savings and investments – they want a seamless digital experience with fast settlement times. Investment products and the infrastructure fund managers and platforms use (and expect investors and their advisors to use) are not keeping up with this change.
Technological evolution can help both asset managers and investors. Friction in the system hampers innovation and is a major source of cost, and cost is by far the most deleterious long-term killer of investment returns.
Calastone knows this. The dollars you save are the easiest dollars you make. Our global network and leading technology drives growth and innovation, whilst eliminating layers of cost, risk and admin – helping protect margins for asset managers, and boosting returns for investors.