
Calastone is the largest global funds network, connecting the world’s leading financial organisations. We handle millions of transactions worth more than $3.5tn every year, split across funds of all asset classes. Our mission is to reduce complexity, risk and costs, enabling the industry to deliver greater value to investors. We connect thousands of fund organisations, enabling them to streamline operations and enable seamless distribution.
Our privileged position at the heart of the global funds industry means we can see the big trends in investor behaviour as they form, and the immediate response investors make to the news as it breaks.
2024 marked a big turning point in global markets as central banks began the long-awaited process of cutting interest rates as inflation in most major economies finally came back under control.
Our latest annual review shows how investors have responded to this and the other big trends of 2024.
Fund Values
Trading Volumes
Net Fund Flows
Focus on Fixed Income – Net flows
Focus on Equities – Net flows
Focus on Active v Index-tracking – Net flows
Equities
Fixed Income
Focus on ESG – Net flows
Focus on Property – Net flows
Focus on Mixed Assets– Net flows
[1] Source: ICI Global Q2 2024 figures, adjusted for market movements and for Australia not being represented in the figures
[2] All figures referenced in the summary are January to November unless otherwise explicitly stated
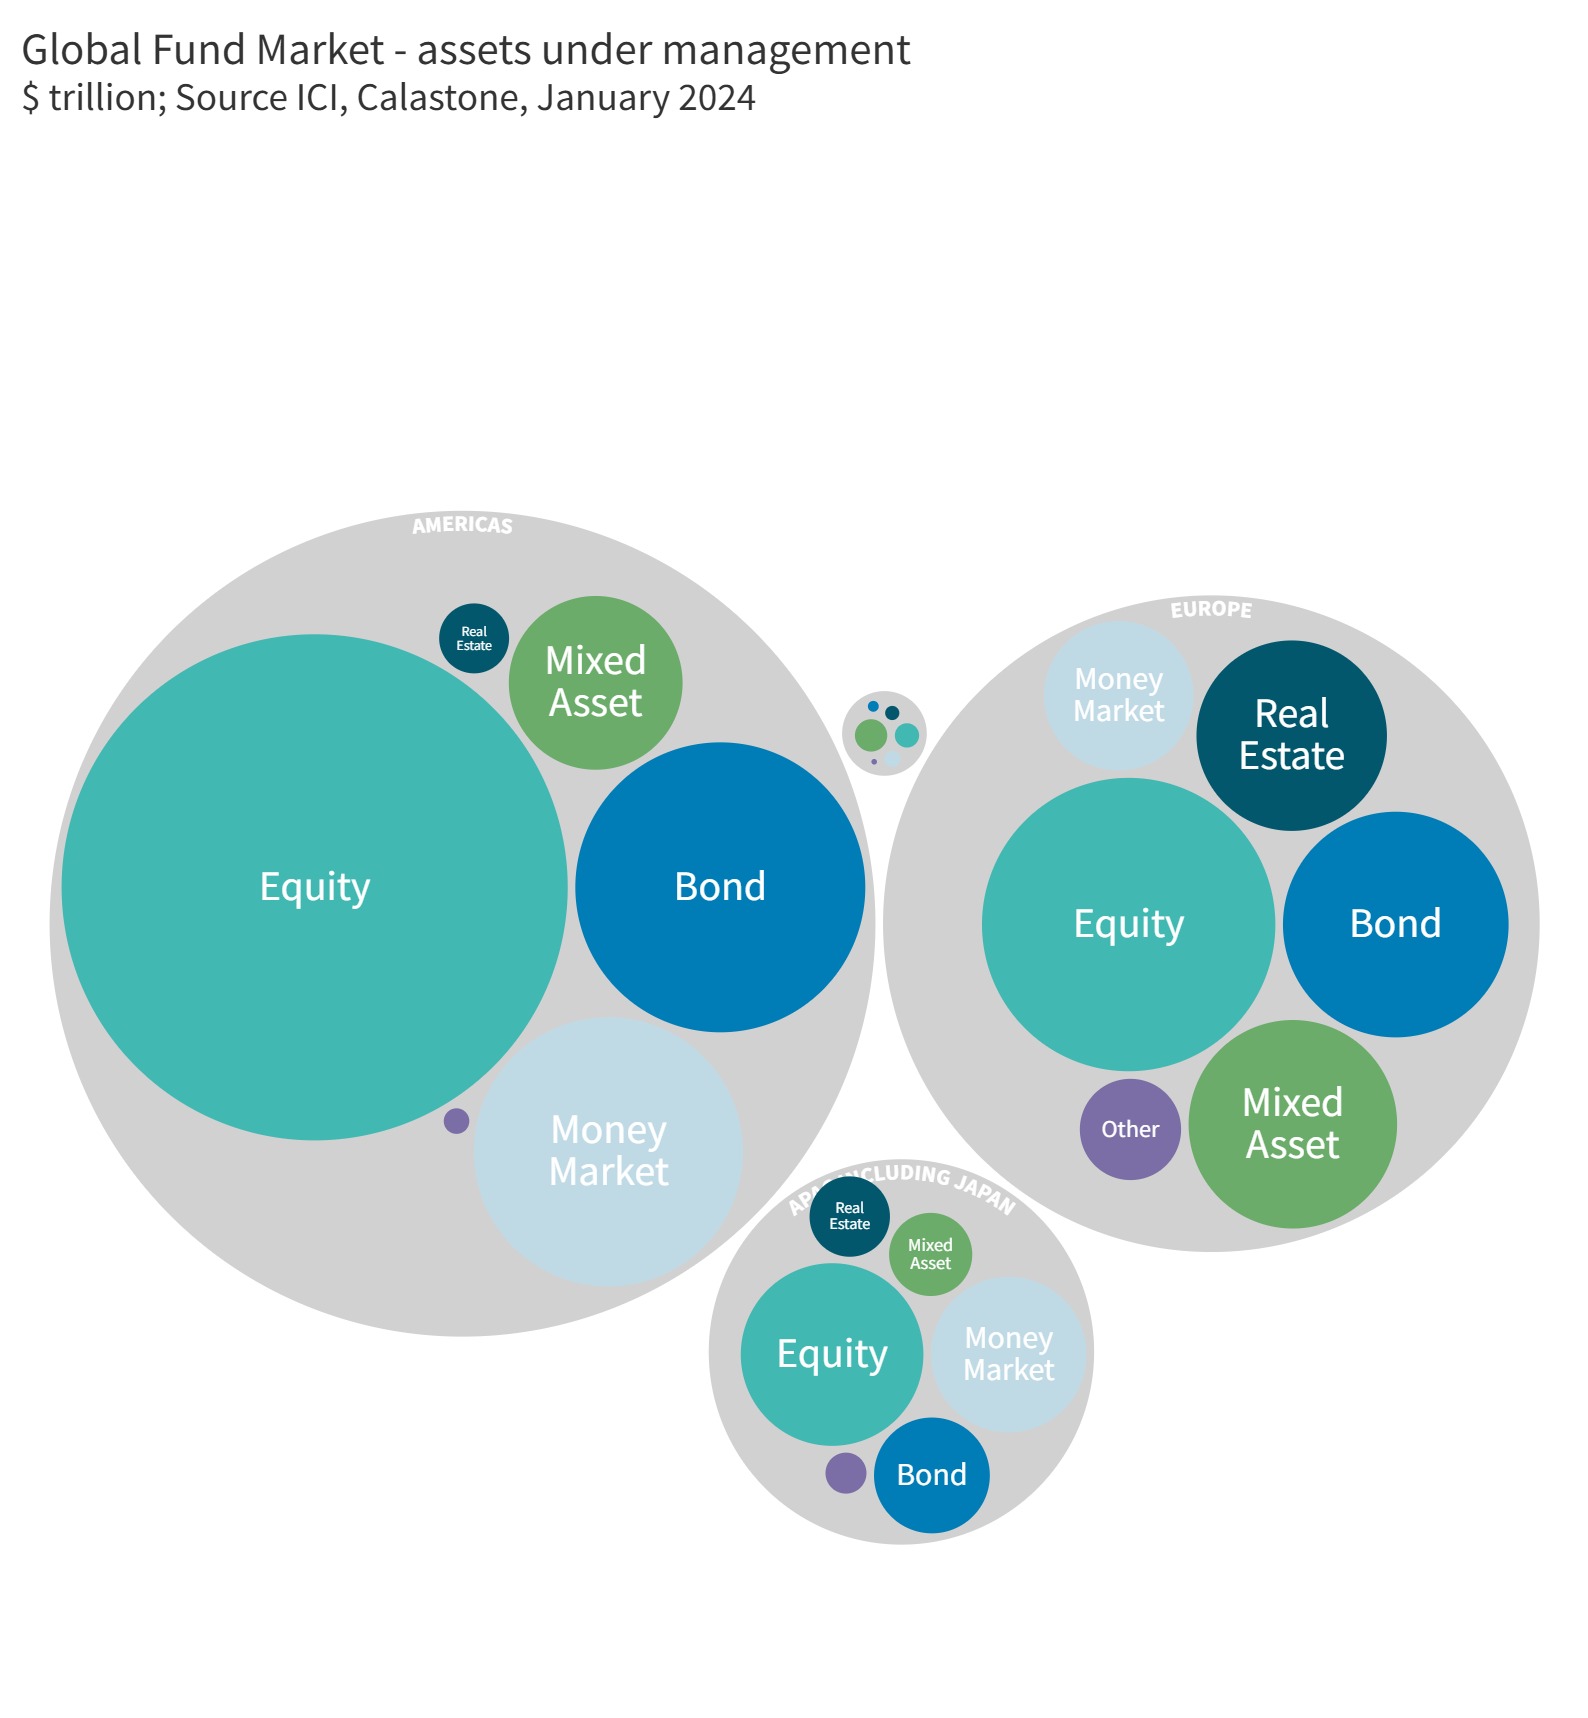
Fund AUM Surge to New Record in 2024
Global mutual fund assets surged $9.35 trillion[1] to a new record in 2024. At $78.2 trillion, AUM was 13.6% higher by December 2024 than at the end of 2023[2] and is roughly double where it was nine years ago. It has also now comfortably surpassed the previous peak reached at the end of 2021, just before an aggressive succession of interest rate increases by central banks in most major economies began to suppress asset prices of all kinds.
2024’s rebound reflects the strong performance of equity and bond markets as well as fund inflows that were significantly more positive than in the previous two years. We estimate that fund flows accounted for around a third of the AUM increase in 2024.
[1] Source: ICI Global Q2 2024 figures, adjusted for market movements and for Australia not being represented in the figures
[2] Calculations to 1st December 2024
Unlike a regular marketplace, a seller is not offloading an unwanted fund unit to a willing buyer, so fund volumes are not comprised of equal values of buy and sell orders. Instead, units are created or destroyed as cash flows in or out of the fund. The value traded reflects how actively engaged buyers and sellers are as well as the prevailing level of asset prices. 2024 was busy. Across our global network we saw volumes of the three main asset classes of equities, bonds and mixed assets increase by 34% year-on-year between January and November to a record $1.32 trillion. December data is not available at the time of writing, but we expect another $104 bn to have been added to the total during the month. This follows two rather subdued years. 2022’s bear market saw volumes fall sharply with only a partial recovery the following year – none of the three main asset classes saw volumes regain previous highs in 2023. 2024 was a very different story.
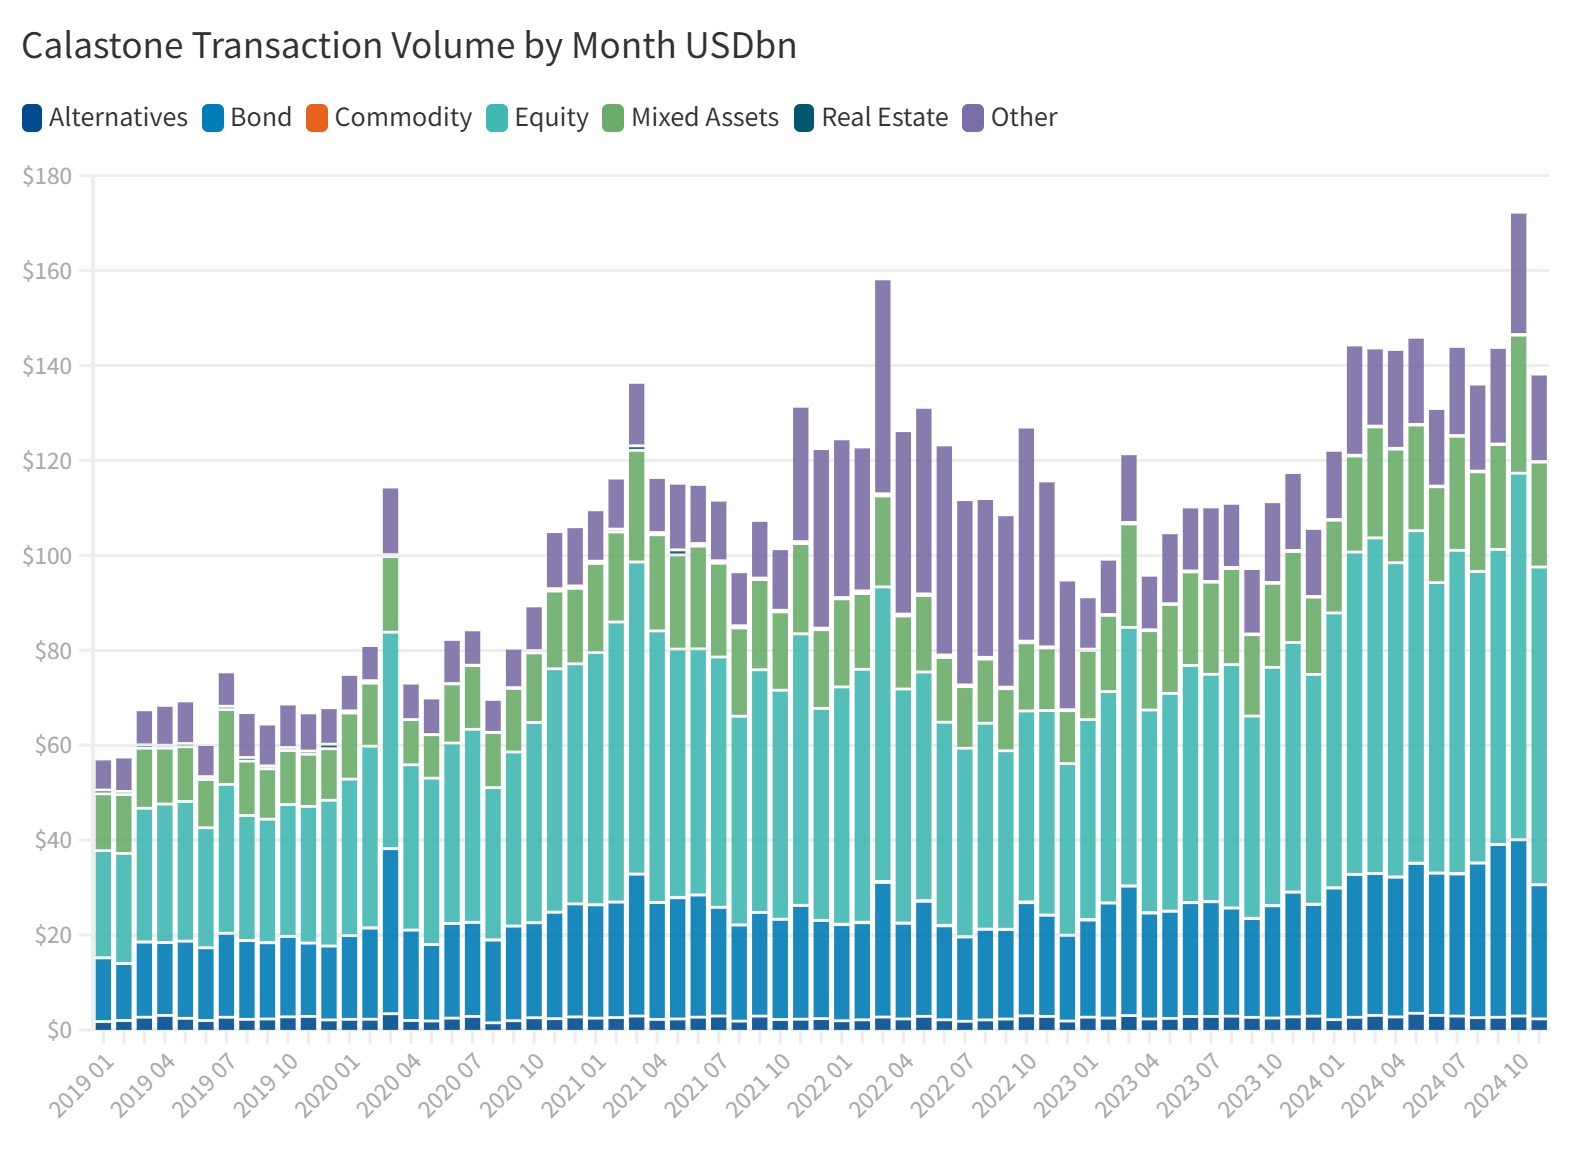
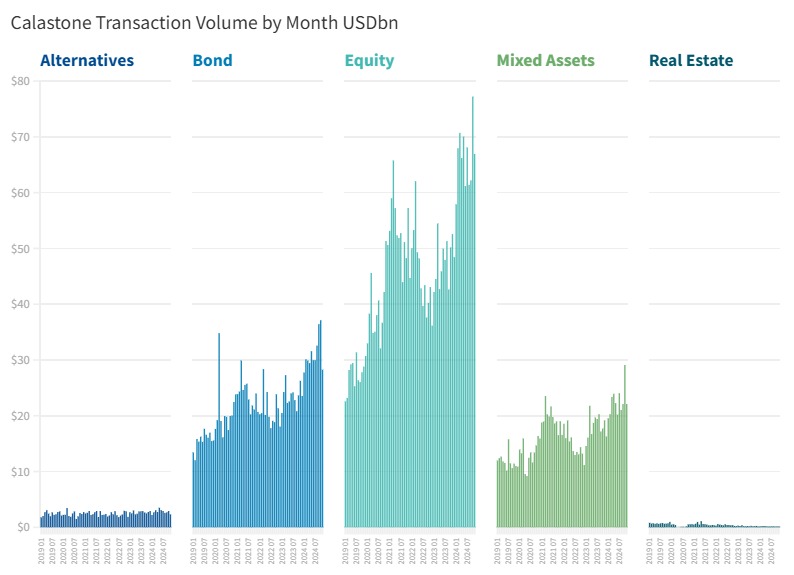
Equity volumes across our network soared 39%[1], of which around half can be explained by equity values which were on average a fifth higher in 2024 than 2023[2], but the other half reflects both greater activity among investors as well as Calastone’s increasing market share around the world. Fixed income funds also had a busy year with volumes up by a third (33%), the vast majority of which was due to greater activity and market-share gains rather than price changes in the underlying bond markets. The trading volume of mixed asset funds, which have become less popular in recent years, rose by almost a quarter (+23%), though the net picture was less positive. Meanwhile, funds in investing alternative assets saw roughly flat volumes, while commodity and real estate funds were down year-on-year.
We typically see volumes increase when markets are strong. Investors tend to eschew volatile markets, preferring to resist the trade button until calmer markets return. This helps explain why trading volumes fell so much in 2022. The average [3] measure of market volatility was closer in 2022 to levels experienced in the years of the dotcom crash and the Global Finance Crisis. It was calmer in 2023 prompting more trading, and in 2024 it dropped back even further to levels similar to those experienced between 2013 and 2019. Investors took their cue by engaging far more actively with their holdings and volumes duly surged.
[1] January to November 2024 compared to January to November 2023
[2] Based on average level of MSCI All World Index
[3] VIX is a measure of market volatility calculated by the Chicago Board Options Exchange. It derives implied market volatility from options pricing and although it is focused on the US S&P 500 it is a helpful indicator of global market conditions. The stock market usually rises when the VIX falls and vice versa

Across our global network, we saw equity volumes rise strongly in almost all our major territories. The increase was particularly strong in Asia, with Taiwanese and Singaporean investors being significantly more active after cutting their trading as interest rates began to rise in 2022. In Europe and the UK volumes jumped by almost two fifths, and they were up by more than one fifth in Australia. Fixed income volumes also rose fastest across Asia, while those in Australia, Europe and the UK rose in the between 14% and 16%.
Net fund flows can seem very large, but they are in fact just the very small residual difference between enormously large volumes of buying and selling. Since the beginning of 2019 we have processed $6.07 trillion of orders in equity, bond and mixed asset funds, but net inflows have been more than twenty times smaller at just $276 billion. In equity funds alone, net inflows have equalled just 1.5% of the asset class’s $3.29 trillion total trading volume across our network in the same period.
Buying activity is the more important driver of changes in net fund flows than selling for a structural and a cyclical reason. Structurally, long-term savings trends bias fund flows in favour of buying, especially as populations age and people set aside cash to see them through retirement.
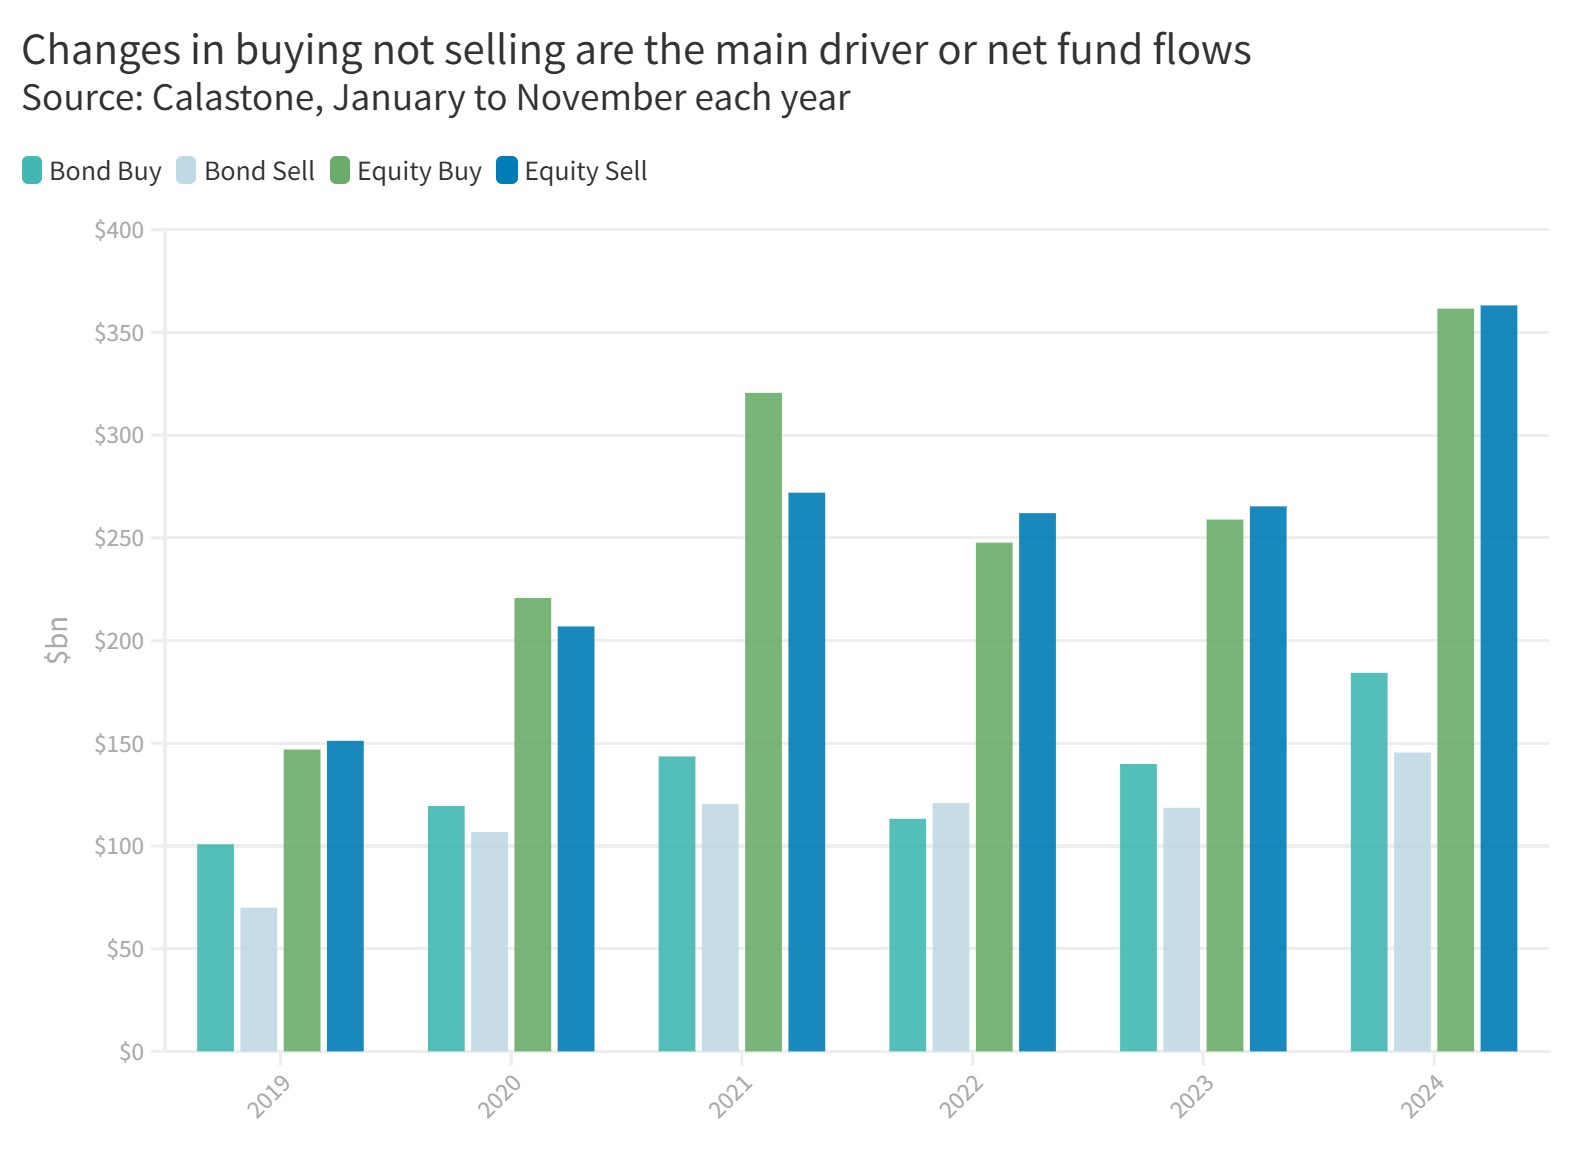
The cyclical point relates to our earlier observations on how investors behave in stable versus volatile markets. There is much less variation in selling activity in periods of weak markets than there is in buying activity. In fact over the last six years, selling activity has been one quarter less variable than buying. Volatility is synonymous with risk: buyers are more likely to stay their hand when markets are weak or volatile. It feels more painful to lose money on a recently bought investment than it does to give up some of the gains we have already enjoyed – the first feels like actual money lost, while with the second we can console ourselves that we are still in profit. Of course, there is no actual difference between the two situations but the cognitive bias of loss aversion is a powerful one and we can see its effect in our fund flow data.
So, if buying drops but sell orders remain steady, the result is an outflow. We have to be careful therefore about how we talk about outflows when they happen. If they were driven by a sharp increase in selling, then it would be fair to talk about a rout. But if reduced buying is the reason, it is much more about investors waiting for calmer markets to return.


2024 was a much better year for fund flows than either of the previous two years. Across fixed income, equities and mixed asset funds, net flows jumped to $61.0bn between January and November, up from just $23.9bn in the same period in 2023. 2024 was the second-best year since we began compiling these figures in 2019.
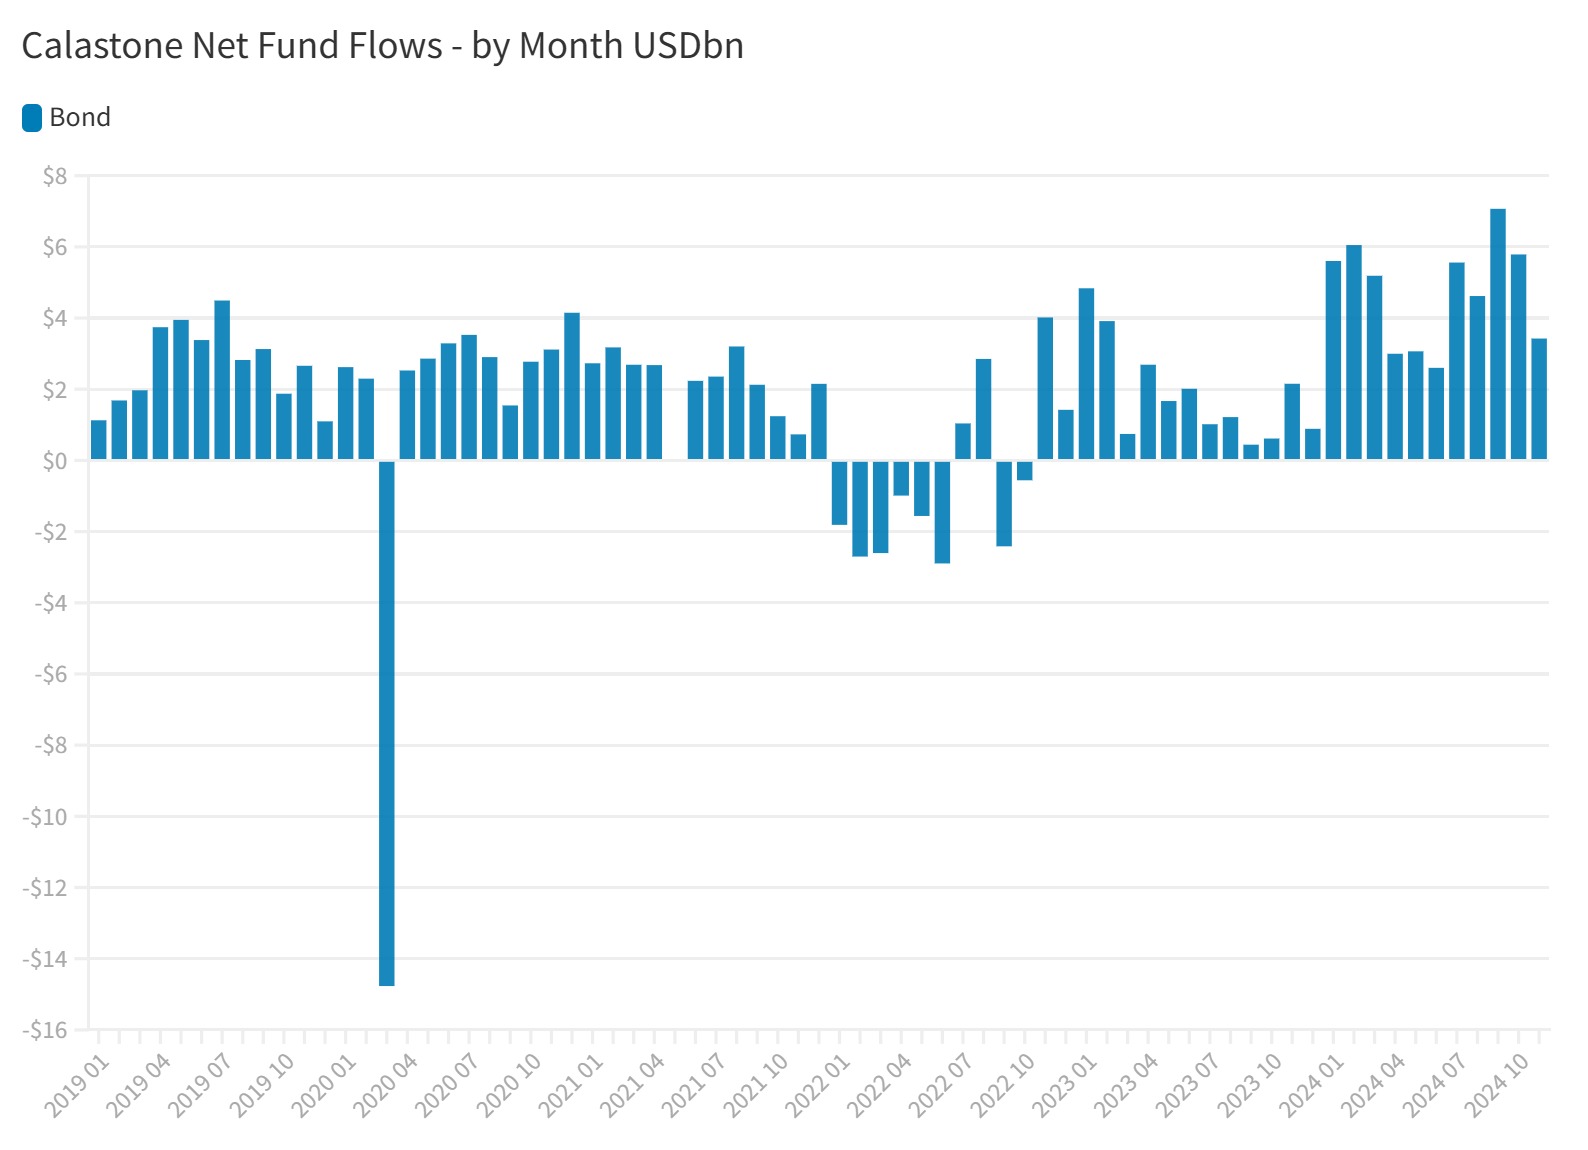
Investors are cautious, however. Fixed income funds have been the main beneficiaries of inflows for the second year running. Globally, investors on our network added a net $52.0bn to the asset class between January and November 2024, easily the best year on our six-year record and more than the previous four years combined. Clearly the central banks’ pivot to from rate hikes to rate cuts was the key catalyst for this increase as investors anticipated capital gains. Inflows had also been quite strong in 2023 (+$21.3bn), but this proved premature as persistent inflation in many parts of the world and strong US economic growth meant sovereign bond yields rose through much of the year, suppressing bond prices.
In 2024, the expectation that rate cuts would finally arrive pushed bond yields down again and delivered capital gains to investors as prices rose. However, shortly after the US Federal Reserve’s first rate cut in September, sovereign bond markets once again deflated, giving up most of the gains they had enjoyed up to that point. There is a logic to continued buying however. When yields are high and short-term interest rates are falling, bonds enable investors to lock into a high income in contrast to cash sight-deposits which feel the effect of rate cuts almost immediately.
Corporate bonds, particularly in the riskier high-yield market, have fared better than the safest government securities, with yield spreads over sovereign bonds compressing to extremely low levels in 2024 as resilient economies have meant solid fundamentals for companies. This compression delivered capital gains and attracted investors during the year. Companies are at a higher risk of default than the governments of most rich-world economies, so higher yields usually compensate investors for this difference. The lower spread means their bonds are more risky now both in absolute and relative terms.
Inflows to bond funds rose in Asia, Europe, the UK and Australia and were at the highest on our six-year record in every territory where we see significant volumes. For example, they were three times larger year-on-year in Hong Kong and Australia, almost twice as large in Singapore and went from almost nothing in Europe in 2023 to $6.0bn.
Equity funds typically get more attention than fixed income, though the bond markets are the true driver of asset valuations of all kinds. It is perhaps surprising to note that thanks to 2024’s strong inflows, fixed income funds have seen investors subscribe more net new cash since the beginning of 2019 ($142bn) than all the other asset classes combined ($113bn).

Bond markets have been trickier to navigate, but equity markets have continued to soar. The US stock market in particular has pulled even further ahead of its global peers. The S&P 500 was up 27% by early December, compared to 19% for the DAX in Germany, 18% for Hong Kong’s Hang Seng, 11% for Australia’s ASX 200 and 8% for the UK’s FTSE 100. France is among the markets to see share prices fall. Even without the exceptionally positive contribution of the Magnificent 7 tech companies, the US market has set the pace over the last year.
Yet equity inflows have been anaemic, totalling just $3.5bn between January and November 2024, a fraction of their fixed income counterparts. This does mark an improvement with the first inflows since 2021: in 2022 and 2023, investors withdrew $20.8bn in total. Trading volumes in equity funds comfortably at record highs combined with very low net flows, indicates that there is a lot of disagreement among investors over the right course, as well as switching between fund sectors. Moreover, there was a very wide dispersion between the favoured fund strategies and those investors are avoiding.
Two fund sectors were the stand-out winners. Global equity funds, which are about 60% weighted to the US, absorbed $18.0bn, while North American funds (which are around 92% US) saw net inflows of $9.0bn. This clearly indicates that investors have been chasing the winners.
Meanwhile, European equity funds saw their first year of inflows on our 6-year record, with investors committing a net $2.9bn to the sector. Although France is an outlier reflecting its political stalemate and difficulties facing its global luxury goods brands in core Chinese markets, stock markets in Europe had a good 2024. Germany, Spain, Italy and the Netherlands are all among those to see strong double-digit growth and this has spurred inflows. Investors in most of our territories were buyers of European equity funds in 2024.
Asia-Pacific is out of favour for the third year in a row. Outflows accelerated to $4.6bn between January and November, their largest on our six-year record. Local investors were major drivers of the net-selling, but none of our territories saw investors add net new cash to funds investing in the region.
UK-focused equities did worst of all. The UK’s stock market lagged behind global peers, reflecting the significant weighting of energy stocks in the index. Outflows are being driven overwhelmingly by domestic investors who seem increasingly to be giving up on the growth prospects of a stock market that has underperformed badly in recent years. Meanwhile, with the UK market now only a very small weighting in global indices, it is easy for overseas investors to overlook it entirely; $13.3bn left UK equity funds between January and November 2024.

Index funds were the clear winners in the fight for investor capital in 2024, for the third year in a row. Between January and November, investors added a net $17.5bn to index-tracking equity funds and withdrew a net $14.0bn from actively managed ones. Investors in all our territories strongly favoured passive equity funds in 2024.
Most equity fund sectors have seen investors favouring trackers too – active funds investing in Europe, Asia, the UK and Australia have all seen outflows this year while their passive counterparts have enjoyed inflows (except those with a UK focus which have seen outflows in active and passive funds). Two major sectors stand out – namely global and North American funds. The former has strongly favoured active funds over the longer term. Since 2019, $69.3bn has flowed across our network into these funds, compared to $25.7bn into equivalent index trackers. Meanwhile active funds focused on North America reversed most of the outflows experienced in 2023 – between January and November 2024, they garnered $6.4bn of new capital, breaking the longer-term trend that has favoured index trackers.
Why might this be so? It is possible that investors want US exposure, but have become wary of the extreme concentration of the US stock market this year, which has seen five stocks (Apple, Microsoft, Alphabet, Amazon, and Nvidia) reach a collective value of $14.5 trillion, more than a quarter of US market capitalisation and equal to Europe’s and the UK’s total stockmarkets combined. Active funds can in theory take underweight positions in these companies, though they can equally go overweight too. Our analysis does not go down to fund level to protect confidentiality, so we can only speculate that this may be the motivation.
In the fixed income space, active managers are doing much better than in equities. Of the $52.0bn of bond-fund inflows between January and November 2024, $38.8bn or 75% were into actively managed funds. Since the beginning of 2019, just over two thirds of the capital investors have added to fixed income funds has been handed to active managers.
It is not so everywhere. Asian and Australian investors are the real drivers of active bond-fund inflows. Australians added three times as much capital to active fixed income between January and November 2024 compared to passive funds, consistent with the long-term picture there. In our other main Asian territories, active funds beat passive ones for $65 out of every $66 committed to the sector last year, twice as much as over the previous five years ($33:1). Meanwhile UK investors strongly preferred index funds in 2024 and have committed three fifths of their fixed income purchases to the passive sector over the last six years. European investors have also generally preferred index-trackers over the longer term, but opted more strongly for active funds in 2024.
Passive funds do not work the same for fixed income as they do for equities. Investors can expect an equity index fund to own every name in the benchmark in matching proportions. But for fixed income funds there is much more sampling to attempt to match the risk characteristics of the benchmark – they do not own every bond in issue included in the index. Benchmarks also tend to include a large number of lower quality bonds and so will be relatively volatile. Active managers contend that there are a number of ways they can add value, for example by managing interest rate risk, credit quality, maturity positioning, sector exposure and other factors to generate excess returns. Their message seems to have landed. Even in the UK and Europe, where fixed income index trackers are more popular than in Australia and Asia, they are still not as popular in relative terms as those in equity markets. Investors therefore seem more inclined to give active bond fund managers the benefit of the doubt compared to those actively attempting to beat equity markets.


The ESG gold rush that took place between 2020 and the middle of 2023 has ended. Between May 2023 and November 2024, investors across our global network withdrew $15.5bn from equity funds with an ESG mandate, reversing more than a quarter of the $53.7bn that had been committed to such funds in the previous four and a half years. Actively managed ESG equity funds have been especially hard hit, shedding $23.1bn of capital in the same period, more than half the $40.1bn that had been committed to active ESG funds before then.
Accusations of greenwashing have undermined trust in the sector, while criticism that standards are too subjective, too vague, or too inconsistent from one fund to another have made it difficult for investors to make informed choices. Complexity remains a major problem too. Social, environment and governance are three very different areas of interest so a fund with a high ESG ‘score’ might be hitting none of the areas that an investor cares most about.
Investors are also less interested. Just 48% of UK investors said they consider ESG factors, according to a 2024 survey by the Association of Investment Companies, compared to 66% in 2021, while 61% said there were not convinced by funds’ ESG claims. Greenwashing is a concern for two thirds of respondents. The change in attitudes is almost certainly reflected globally. Institutional investors are even more sceptical. A study by Edelman conducted at the height of the ESG boom in 2021 found that almost three quarters do not trust companies to achieve their stated sustainability, ESG, or DEI commitments.
The outflows slowed in 2024, though this is more a function of generally better conditions for equity funds during the year than in the previous two – a rising tide can lift even a partially submerged boat after all.
Between January and November 2024 $2.9bn was withdrawn from ESG equity funds on our network, even as investors added a net $6.4bn to funds not making any ESG claims. Investors are not behaving the same everywhere, however. While European and Asian investors have withdrawn capital from ESG equity funds while at the same time adding it to non-ESG funds, in the UK, investors have added to both. In Australia, where equity funds overall have seen the extremely low inflows this year (just $248m) after outflows in 2023, ESG funds have seen net subscriptions while conventional equity funds have seen redemptions.
The difficulties facing ESG funds do not reflect wider societal concern. Surveys of consumers consistently show that people all over the world think companies should be adopting ESG best practices. The loss of investor confidence instead reflects the difficulty translating all this into a measurable investment proposition. The International Organization of Securities Commissions, an association of global regulators, has made a series of recommendations aimed at improving the way ESG ratings services are provided by agencies and used by investors, and at improving corporate disclosure. Draft legislation in the UK aims to bring ESG ratings within the scope of regulation and has received industry support. ESG may be down, but it is not necessarily out.
Real-estate funds continued to spiral downwards in 2024. Equities and fixed income are firmly cemented as the long-term savings vehicles of choice for fund investors. Property funds do not share this privileged position. The asset class is more marginal in itself and prone to cycles of boom and bust but the open-ended fund structure no longer has the confidence of many investors and so the outflows continue. Moreover, even though interest rates are now falling, they remain high relative to the last 10 years. High interest rates impact both the cost of finance for property and the present value of future cash flows. In addition the post-pandemic property market has still not fully found its feet. Property funds shed $615m between January and November 2024, their sixth consecutive year of net selling.
Mixed asset funds saw inflows fall in 2024 to their lowest level on our six-year record. At $5.6bn between January and November, net buying was nevertheless stronger than for equity funds which they have beaten for three years in a row. The popularity of fixed income in 2024 helps explain why mixed assets garnered more capital than pure equity funds over the last year but the longer-term picture is driven in particular by European investors, for whom the mixed-asset structure has attracted more capital than equities (or had smaller outflows) every year since at least 2019. Asian investors have also tended towards mixed assets and preferred them decisively in 2024, consistent with their anti-equity, pro-bond stance. The last two years have seen UK investors turn decisively against mixed assets, however, perhaps because bond and equity-market correlation means they have not fulfilled their traditional diversifying role. Australian investors have more in common with their British counterparts than their Asian neighbours.
2024 has been an extraordinary year. Stock markets worth seven tenths of global market capitalisation are at record levels, spanning the globe from the US to Europe and Asia-Pacific.
The year of elections that saw around two billion voters eligible to go to the polls has, as we cautioned this time last year, kept the fiscal taps open and this is storing up trouble for the future. Bond markets have reacted accordingly, keeping longer-term interest rates high even as short-term policy rates fall. High long-term interest rates are bad for investment and in theory for asset prices though the stock markets are still fixated on the sugar rush of deficit spending which boost economic activity and therefore company earnings in the short term.
Interest rate cuts are likely to continue, though more slowly than some had initially hoped, while geopolitical and trade concerns remain heightened. The global economy is seeing a slowdown at present though most observers are relatively relaxed that it will avoid a hard landing.
At Calastone, we do not predict asset prices, but our unique position gives us a real-time lens into investor sentiment and market flows. This insight is crucial in helping the industry create value regardless of whether markets are rising or falling. Our mission is to reduce complexity, risk, and crucially friction, streamlining the global investments marketplace. Friction equals cost and its cumulative impact on an investor’s long-term returns is enormous. By helping eliminate it, Calastone’s network benefits the asset management industry and it helps it deliver greater value to the investor. Over 4,000 clients in 56 countries and territories, along with tens of millions of end investors, benefit from Calastone’s services.
Where is asset management going? The answer lies not only in the technology and tools we’re adopting but in how we’re fundamentally reshaping client relationships, operational models, and the way we think about value. By adopting emerging technologies thoughtfully and adapting to regional dynamics, whether that be in mutual funds, money market funds or ETFs, the asset management industry can ensure its resilience and relevance in the face of evolving investor expectations.