
Greenland tensions triggered renewed equity fund outflows
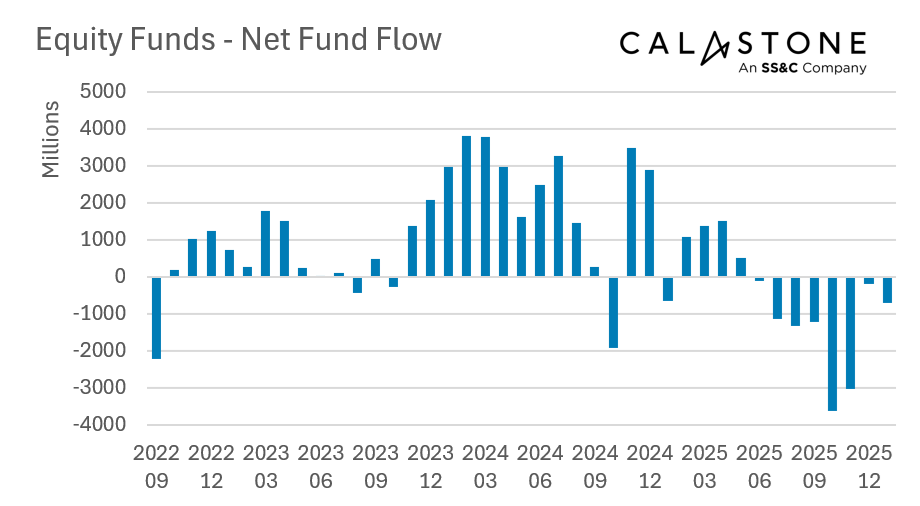
Greenland tensions drove a flight from equity funds in January, marking a weak start to 2026, according to the latest Fund Flow Index from Calastone, the largest global funds network. Outflows totalled a net £697m during the month, after a calmer December. January extended the bout of net selling to an unprecedented eighth consecutive month.
Late-January Greenland escalation marked a clear turning point in monthly flows
Two pieces of evidence link the outflows to developments in Greenland.
The first relates to the timing of flows. After a quiet first half to the month which saw outflows and inflows roughly in balance, the prospect of US tariffs on the UK and European nations for sending military planners to the island caused stock markets globally to falter. Outflows from equity funds accelerated sharply on January 19th and continued for the rest of the month.
European and UK equity funds bore the brunt of selling
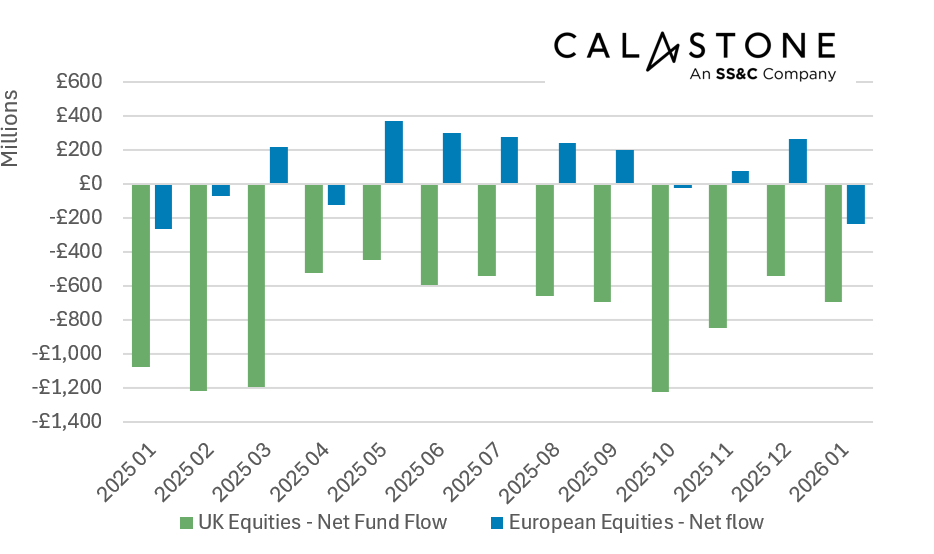
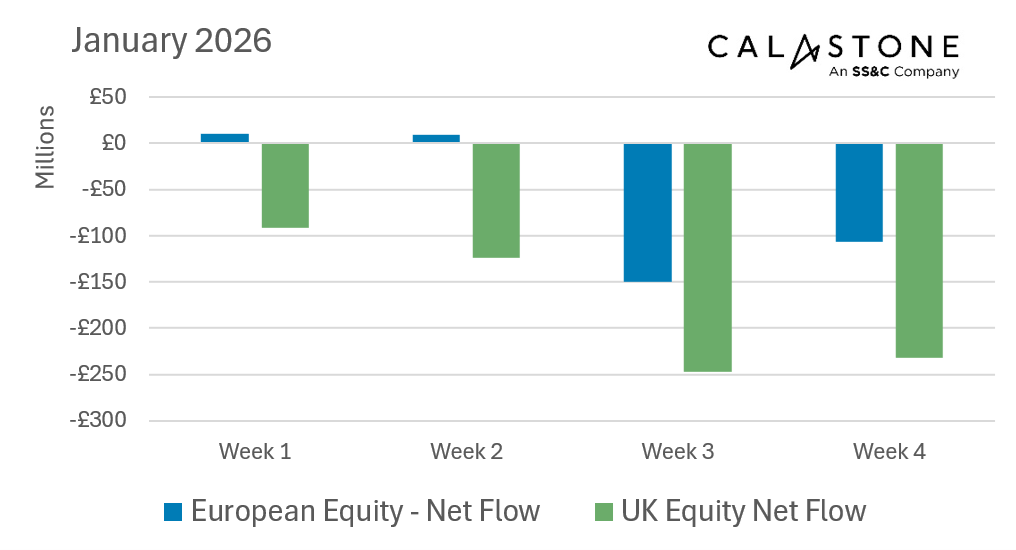
The second piece of evidence concerns the fund sectors that bore the brunt of the selling – namely European and UK-focused equities funds. European equity funds suffered their worst month since January 2025, as investors pulled £237m from the sector. Meanwhile UK-focused funds had been on track for the smallest outflows since May 2025, but after sell orders ramped up from 19th January the month ended down £694m.
Other regions largely insulated from Greenland concerns
Other fund sectors did not show the same pattern. Outflows from Asia-focused funds continued, but remained in line with the monthly average – in an unbroken almost three-year stint of monthly selling – and there was no change as the month progressed; outflows from Japanese equity funds were lower in January than in recent months and were smaller in the second half of the month. Meanwhile, emerging markets, global and North American funds all absorbed new cash.
Edward Glyn, head of global markets at Calastone said: “The pace of outflows in January was far slower than in the run up to the Budget, where a record flood of selling was prompted by concerns of possible higher pension and investor taxes. This indicates that the risk of conflict over Greenland was more of a tail risk in investors’ minds rather than a clear and present danger. It shows, however, that it doesn’t take much to fracture fragile sentiment, especially when stock prices are riding this high. Investors now have to be more alive to geopolitical factors than in the past and they are titrating their geographical allocations accordingly.”
Fixed income and mixed assets remained steady amid equity weakness
Among other asset classes, fixed income funds enjoyed £459m of inflows in line with the average of the last six months. Inflows were mainly in the corporate bond sector – sovereign bond funds saw outflows. Inflows to mixed asset funds of £1.05bn remained in line with their ten-year monthly average, reflecting their anchored position in monthly savings plans. Money market funds saw their first outflow since April 2024, though January is typically a weak month for these cash funds, likely as Christmas credit-card bills are settled.

Methodology
Calastone’s Fund Flow Index (FFI) is the most widely followed, most timely, and most comprehensive tracker of fund flows in the UK. Because it relies on real trading data by investors, rather than survey opinion, it is also the most accurate.
The FFI analyses millions of buy and sell orders in individual funds every month from millions of UK-based investors. More than 85% of all UK fund flows by value pass across Calastone’s network. To avoid double-counting, however, the analyst team excludes funds of funds. Totals are scaled up for Calastone’s market share.
Net fund flows are the difference between the value of investor buy orders and investor sell orders. The value of buy orders and the value of sell orders are both very large – the net flow is typically very small in comparison to this large amount of trading activity.
Calastone only measures orders from UK-based investors into funds domiciled in the UK. Note that this has nothing to do with where the underlying assets are invested – a UK-domiciled fund may invest in Japanese equities, Australian fixed income, a global portfolio of mixed assets, or just UK equities. The fund sector information breaks this down in detail.
Calastone uses the FE Fundinfo dataset to assign characteristics such as fund sector, or active v passive to each fund. Before December 2024 Calastone used Lipper for this function. Calastone has restated all historic data with the new FE Fundinfo data to ensure consistency. The new FE FundInfo provides enhanced coverage, and now includes many funds that are not classified by Lipper. The new FFI is therefore even more comprehensive than before, and the historic data now reflects this improvement. Calastone’s analysts do not judge there to be any material differences in the trends revealed using FE FundInfo classifications v Lipper, though there are minor points of detail that differ in individual months.
Calastone also calculates an index value to enable comparison between different asset classes and fund sectors of different sizes. A reading of 50 indicates that buy and sell orders are equal in value. A reading above 50 means capital is flowing in and a reading below 50 means it is flowing out. In other words, a net inflow of £1m would score much more highly if it is the difference between, say £10m of buys and £9m of sells than if it was the difference between £100m of buys and £99m of sells.