
Investors sold down equity funds for a record ninth consecutive month in February, according to the latest Fund Flow Index from Calastone, the largest global funds network. Outflows accelerated to £927m for the month, making February the worst month since November, when budget jitters dominated sentiment. More than one sixth of the net outflow (£162m) came from specialist sector funds focused on the technology sector.
Between June 2025 and February 2026, a net £12.2bn has been pulled from equity funds, enough to reverse more than a typical year’s worth of inflows.
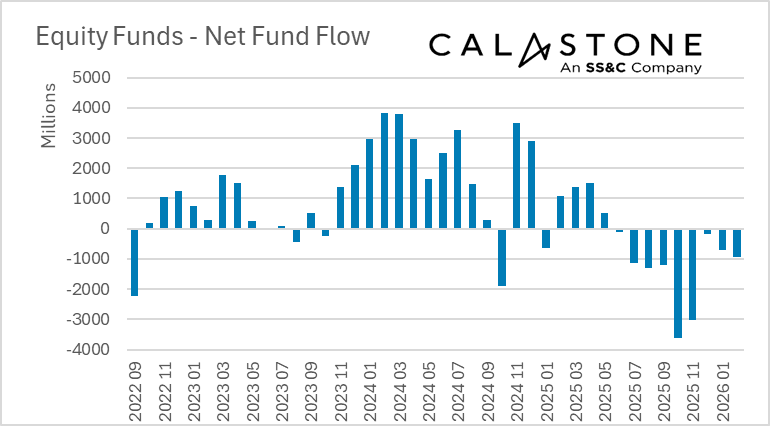
Notably February’s net outflow was driven by a decisive uptick in sell orders which indicates a greater appetite to withdraw capital; it was not caused by a simple buyers’ strike – the level of buying remained relatively steady. The biggest pulses of selling came when markets were weakest in the month – around the 5th, 16th and 23rd, indicating that investors were watching movements closely and reacting.
Edward Glyn, head of global markets at Calastone said: “Investors seem to have got a taste for selling and are looking for reasons to pull money out of funds. Certainly, February was a very volatile month for global share prices as successive waves of panic about which sectors will see their business models disrupted by AI swept through stock markets. But we are not in a bear market even if some pockets of the market are being punished – the global index[1] ultimately ended the month more or less where it began, while the UK top 100 surged 6.7% in just four weeks to a record high. Investors are sitting on large capital gains and it seems that nerves and volatility are driving them out of equities.
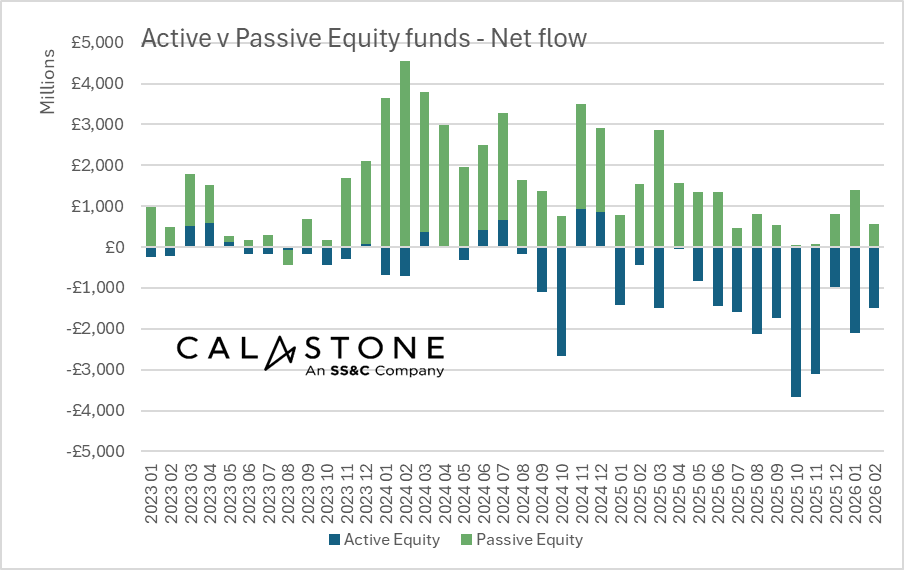
“Actively managed funds are bearing the brunt of the selling. Active equity funds tend to attract investors who are making a choice. They are selecting a manager, a style, a thesis. That often comes with higher engagement, more switching, and a willingness to react when the news shifts. This may explain why they are always first under the hammer.”
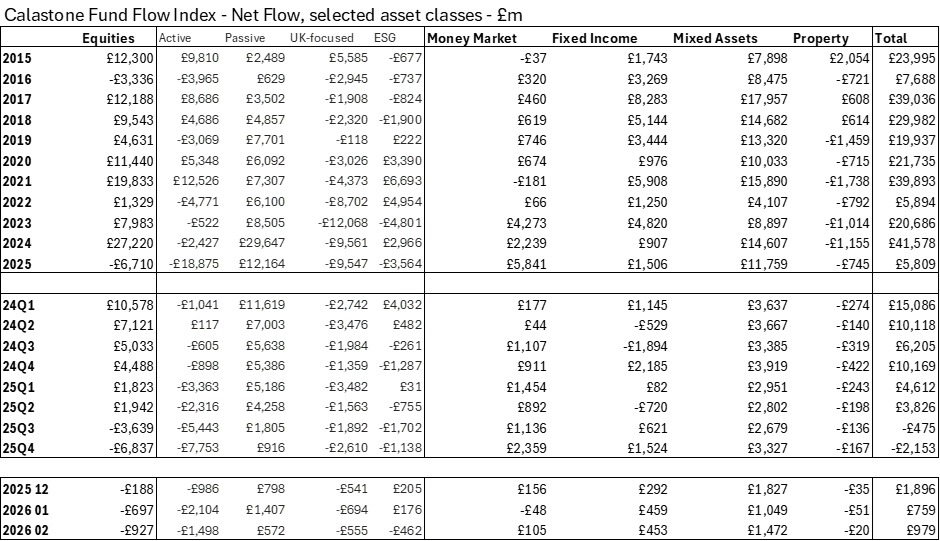
Active equity funds have seen outflows for 14 consecutive months, even as index trackers continue to enjoy inflows. The last time passive funds saw redemptions was August 2023. In February investors sold down £1.50bn of active funds but bought £571m of passive ones.
Across all equity funds, outflows were strongest in UK equities (-£555m), global funds (-£518m) and specialist sector funds (-£284m) – in the sector category, three fifths of the outflow was from technology funds (-£162m).
Among other asset classes, there were steady inflows to fixed income funds (+£453m) and money market funds (+£105m) and ongoing strong inflows to multi-asset funds (+£1.47bn).
Methodology
Calastone’s Fund Flow Index (FFI) is the most widely followed, most timely, and most comprehensive tracker of fund flows in the UK. Because it relies on real trading data by investors, rather than survey opinion, it is also the most accurate.
The FFI analyses millions of buy and sell orders in individual funds every month from millions of UK-based investors. More than 85% of all UK fund flows by value pass across Calastone’s network. To avoid double-counting, however, the analyst team excludes funds of funds. Totals are scaled up for Calastone’s market share.
Net fund flows are the difference between the value of investor buy orders and investor sell orders. The value of buy orders and the value of sell orders are both very large – the net flow is typically very small in comparison to this large amount of trading activity.
Calastone only measures orders from UK-based investors into funds domiciled in the UK. Note that this has nothing to do with where the underlying assets are invested – a UK-domiciled fund may invest in Japanese equities, Australian fixed income, a global portfolio of mixed assets, or just UK equities. The fund sector information breaks this down in detail.
Calastone uses the FE Fundinfo dataset to assign characteristics such as fund sector, or active v passive to each fund. Before December 2024 Calastone used Lipper for this function. Calastone has restated all historic data with the new FE Fundinfo data to ensure consistency. The new FE FundInfo provides enhanced coverage, and now includes many funds that are not classified by Lipper. The new FFI is therefore even more comprehensive than before, and the historic data now reflects this improvement. Calastone’s analysts do not judge there to be any material differences in the trends revealed using FE FundInfo classifications v Lipper, though there are minor points of detail that differ in individual months.
Calastone also calculates an index value to enable comparison between different asset classes and fund sectors of different sizes. A reading of 50 indicates that buy and sell orders are equal in value. A reading above 50 means capital is flowing in and a reading below 50 means it is flowing out. In other words, a net inflow of £1m would score much more highly if it is the difference between, say £10m of buys and £9m of sells than if it was the difference between £100m of buys and £99m of sells.