



New government inherits a sharp acceleration in equity fund outflows:
Equity fund outflows surged in July as the transition to the new government added a fresh layer of uncertainty over the direction of UK economic policy and taxation, according to the latest Fund Flow Index from Calastone, the largest global funds network.
UK investors withdrew a net £1.61bn, the highest level of selling since October and November 2025 in the run up to the autumn budget (-£3.63bn and -£3.02bn respectively). July 2026 was the fifth worst month for equity funds on Calastone’s 11-year record. The 12-month run rate of outflows has now reached a record £13.9bn.
The figures suggest that concerns generated by tax changes under the previous Starmer–Reeves administration have persisted into the opening days of the new Burnham–Healey government. At the same time, speculation that the new administration could pursue further increases in capital gains tax or introduce other measures targeting wealth appears to be encouraging some investors to act as they assess the implications of the new government’s emerging fiscal agenda.
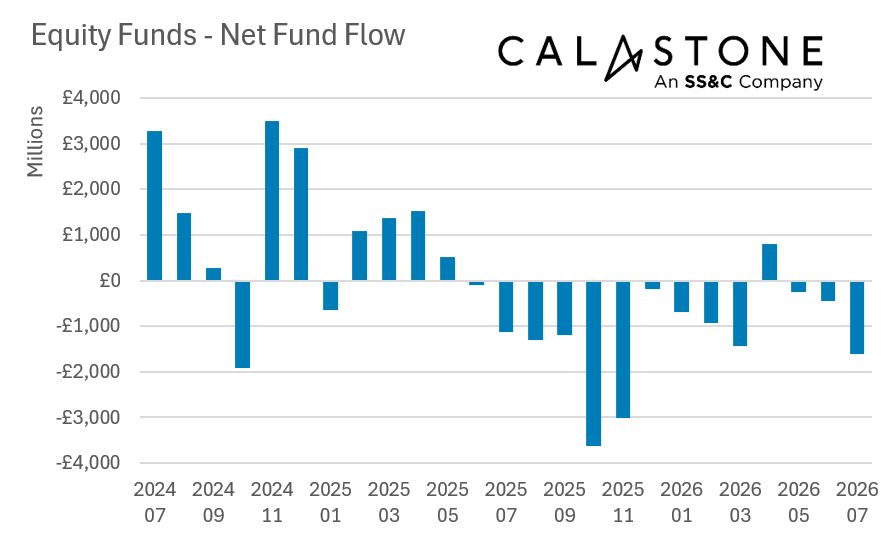
Most equity fund sectors saw outflows:
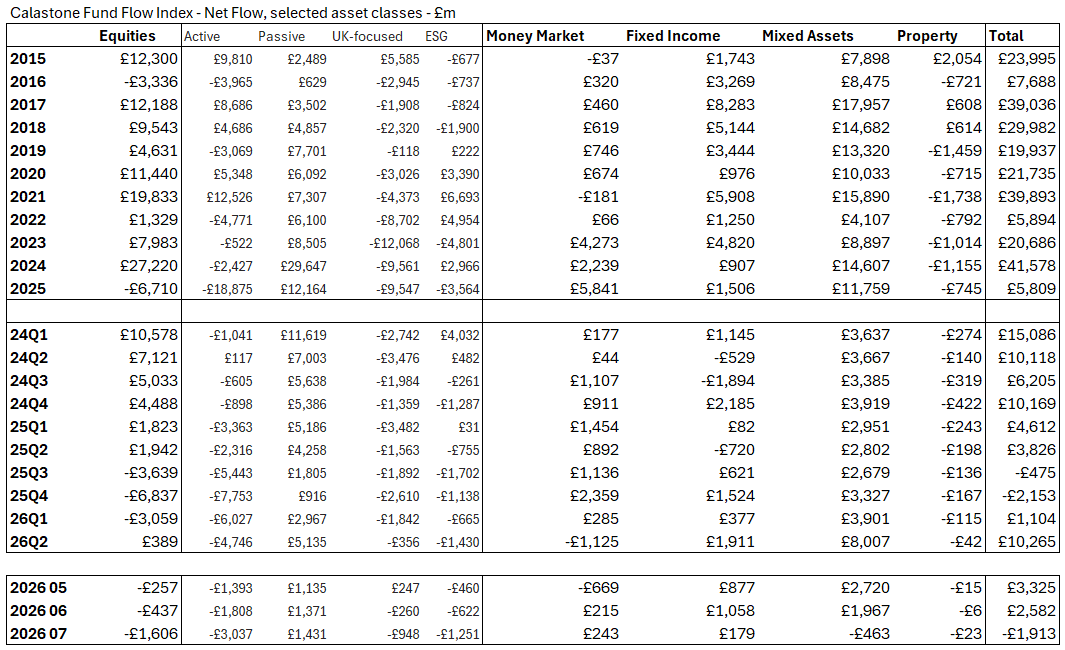
UK-focused equity funds bore the brunt, as investors pulled out £948m of their capital in July. Since they first turned their backs decisively on UK equity funds in June 2020, £52.6bn of cash has left the sector, and only four individual months have seen any capital flow back in. Elsewhere global equity funds shed £574m in July, emerging markets £224m, while sector-focused funds, and Asia, China and Japanese funds also saw outflows. European equity funds were flat and only North American funds saw investors add new capital – a net £227m.
Active funds saw heavy selling – July was the third worst month on record:
Actively managed equity funds were the target for these outflows – totalling £3.04bn and marking the third-worst month on record for active strategies. Passive funds absorbed £1.43bn of inflows, in line with their long-run average.
Multi-asset funds suffered their worst month since 2022:
Across other asset classes, multi-asset funds saw their first outflows (-£463m) since October 2022 in the wake of the notorious Mini-Budget, with sell orders rising to a record £6.58bn. Property funds continued to slowly shed capital, while inflows to fixed-income funds fell to £179m from more than £1.0bn in June.
Edward Glyn, head of global markets at Calastone said: “Tax rises – and even speculation about tax rises – change investor behaviour. The evidence increasingly suggests that policy unpredictability is unnerving investors almost as much as the tax measures themselves.
The decision announced in the last Budget to bring pensions within the scope of inheritance tax has been cited by wealth managers as a reason some pension holders are extracting more capital from their funds, now that those assets will no longer receive the same protection from death duties. Calastone’s figures are consistent with that observation. We have never recorded such a sustained run of equity fund outflows, and the trend began in June 2025 as concerns started to build ahead of Rachel Reeves’ autumn Budget.
Strong stock-market performance has doubtless made the decision easier for some investors. Booking a profit is psychologically much easier than crystallising a loss.
But the July surge suggests that this is no longer only about tax changes already announced by the previous administration. The arrival of a new Prime Minister and Chancellor has reset expectations, but it has not yet provided investors with clarity about the future tax environment.
Speculation that the Burnham–Healey government could further target wealth – including through higher capital gains tax, changes to pension allowances or even an exit tax – may be prompting investors to take precautionary action. Some investors holding funds outside tax wrappers may be choosing to realise gains at current capital gains tax rates, while some people aged over 55 may be taking their tax-free pension lump sums before the rules potentially change.
“Investor confidence is being eroded by fear of the unknown. Even as the new government begins to outline its fiscal agenda, investors are still weighing what it could mean for capital gains, pensions and wider wealth taxation. That uncertainty appears to be influencing investment decisions.”
Methodology
Calastone’s Fund Flow Index (FFI) is the most widely followed, most timely, and most comprehensive tracker of fund flows in the UK. Because it relies on real trading data by investors, rather than survey opinion, it is also the most accurate.
The FFI analyses millions of buy and sell orders in individual funds every month from millions of UK-based investors. More than 85% of all UK fund flows by value pass across Calastone’s network. To avoid double-counting, however, the analyst team excludes funds of funds. Totals are scaled up for Calastone’s market share.
Net fund flows are the difference between the value of investor buy orders and investor sell orders. The value of buy orders and the value of sell orders are both very large – the net flow is typically very small in comparison to this large amount of trading activity.
Calastone only measures orders from UK-based investors into funds domiciled in the UK. Note that this has nothing to do with where the underlying assets are invested – a UK-domiciled fund may invest in Japanese equities, Australian fixed income, a global portfolio of mixed assets, or just UK equities. The fund sector information breaks this down in detail.
Calastone uses the FE Fundinfo dataset to assign characteristics such as fund sector, or active v passive to each fund. Before December 2024 Calastone used Lipper for this function. Calastone has restated all historic data with the new FE Fundinfo data to ensure consistency. The new FE FundInfo provides enhanced coverage, and now includes many funds that are not classified by Lipper. The new FFI is therefore even more comprehensive than before, and the historic data now reflects this improvement. Calastone’s analysts do not judge there to be any material differences in the trends revealed using FE FundInfo classifications v Lipper, though there are minor points of detail that differ in individual months.
Calastone also calculates an index value to enable comparison between different asset classes and fund sectors of different sizes. A reading of 50 indicates that buy and sell orders are equal in value. A reading above 50 means capital is flowing in and a reading below 50 means it is flowing out. In other words, a net inflow of £1m would score much more highly if it is the difference between, say £10m of buys and £9m of sells than if it was the difference between £100m of buys and £99m of sells.