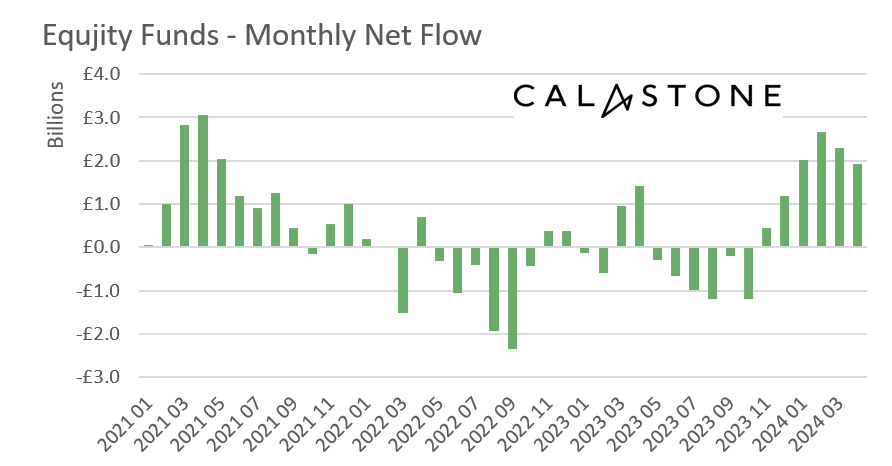
UK investors shrugged off faltering equity markets and the sagging bond market in April and continued to add strongly to their fund holdings, according to the latest Fund Flow Index (FFI) from Calastone, the largest global funds network. They added a net £1.93bn to equity funds and £422m to fixed income funds. Meanwhile, mixed asset funds enjoyed their first month of inflows after eleven consecutive months of net selling.
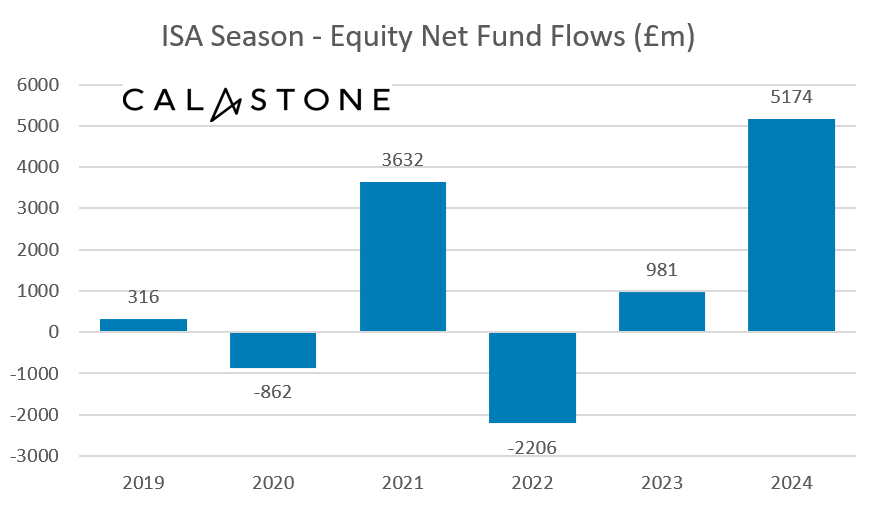
Inflows to equity funds were 5x larger than 2023’s ISA season
The ISA season clearly played an important role. More than half the month’s inflows to equity and fixed income funds took place in the first five days of April, before the 2023/24 tax year ended, as retail investors banked any leftover ISA allowance. For mixed asset funds, strong inflows in the last few days of the tax year had turned to outflows by the second half of the month.
If we take the cumulative inflows during the whole ISA season from the middle of February[1] to the end of the tax year, then equity funds absorbed £5.17bn, more than five times as much as in 2023 (£981m) and better than any year on Calastone’s record.[2]

Equity funds – inflows slowed in April but remained very high
The inflow to equity funds was the thirteenth highest on Calastone’s more than nine-year run of data and followed a record quarter for equity fund subscriptions between January and March (£6.97bn).

Investors were choosy – Global, North America and Europe are in, Emerging Markets and UK are out
Investor interest in North American equities continued in April with net inflows of £1.25bn, the fourth best month on record. The previous three best months were also all in 2024. Global and European equities were also major beneficiaries of investor optimism, absorbing £1.49bn and £471m respectively. Indeed global funds had their best month since April 2023 (£1.59bn) and European funds their third best month on Calastone’s record.
Meanwhile there was a marked reversal of the recent appetite to buy emerging market funds. Investors broke an 18-month run of inflows by selling a net £162m of their emerging-market holdings. The relentless negativity on UK-focused equity funds was undiminished, despite the UK market reaching a record high. Outflows totalled £665m, taking the cumulative withdrawal of capital to £21.3bn in 35 consecutive months of selling.
Index funds are driving inflows
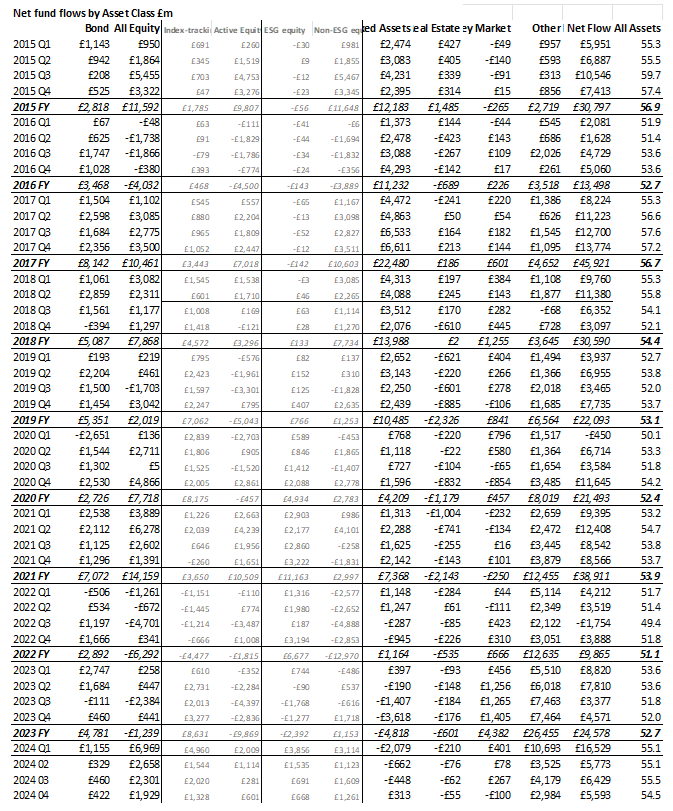
Index funds are the main beneficiary of investor capital at present. Fund flows have strongly favoured them now for 16 consecutive months. Since January 2023, equity index funds (led by North American and Global funds) have taken in £14.92bn of investor cash, while active funds have shed £7.26bn. This followed a protracted two-year period from the end of 2020 to the end of 2022 during which active funds comfortably beat their passive counterparts with inflows of £12.03bn v £626m.
Fixed income funds – inflows despite falling markets
The bond markets had another rough month. The benchmark US ten-year yield rose relentlessly during April, ending the month at 4.68%, up by half a percentage point since the end of March, setting the tone for bond markets around the world. Rising yields push bond prices down. Investors, who are nursing losses on the £1.7bn of bond-fund purchases they made between November and March, nevertheless added a further £422m to their holdings, in line with the long-run average.
Money market fund outflows – investors are taking on more risk
Money market funds stood out, suffering an outflow of £100m in April, the first month this asset class has seen net selling since January 2023. Investors are switching outright from safe-haven money-market funds, despite ongoing high yields, into riskier asset classes. Property funds, which face cyclical and structural problems, saw continued outflows too.
Edward Glyn, head of global markets at Calastone said: “The 2024 bull run in equity markets flies in the face of the uncomfortably bearish signals coming from the bond markets. Inflation in the US, the UK and elsewhere remains obstinately above target and resistant to high interest rates – meaning they are going to stay high for longer. That is bad for asset prices of all kinds, and global equity markets faltered in April, falling almost four percent from the peak. Nevertheless, they remain close to the record high reached earlier in the month, leaving some markets, particularly the US, looking expensive. Investors seem undeterred. Inflows may have slowed a touch, but they are still well above normal levels as investors chase stock prices – the outflow from money market funds is part of this trend. Meanwhile inflows to bond markets show that steady and accumulating losses are not deterring new capital – this is not unreasonable as there are substantial gains to be made when interest-rate expectations turn a corner and high yields mean investors can lock in historically high income levels now for the long term.
“All this helps explain why ISA season has been so strong – our data shows it’s been the best on our nearly 10 year record. Asset managers are cheering huge inflows.”

[1] 15th Feb to 5th April inclusive
[2] Calastone has calculated detail ISA season data for last six years, but summary data indicates 2024 was the best ISA season on Calastone’s 9-year record
METHODOLOGY
Calastone analysed over a million buy and sell orders every month from January 2015, tracking monies from IFAs, platforms and institutions as they flow into and out of investment funds. Data is collected until the close of business on the last day of each month. A single order is usually the aggregated value of a number of trades from underlying investors passed for example from a platform via Calastone to the fund manager. In reality, therefore, the index is analysing the impact of many millions of investor decisions each month.
More than two thirds of UK fund flows by value pass across the Calastone network each month. All these trades are included in the FFI. To avoid double-counting, however, the team has excluded deals that represent transactions where funds of funds are buying those funds that comprise the portfolio. Totals are scaled up for Calastone’s market share. A reading of 50 indicates that new money investors put into funds equals the value of redemptions (or sales) from funds. A reading of 100 would mean all activity was buying; a reading of 0 would mean all activity was selling. In other words, £1m of net inflows will score more highly if there is no selling activity, than it would if £1m was merely a small difference between a large amount of buying and a similarly large amount of selling.
Calastone’s main FFI All Assets considers transactions only by UK-based investors, placing orders for funds domiciled in the UK. The majority of this capital is from retail investors. Calastone also measures the flow of funds from UK-based investors to offshore-domiciled funds. Most of these are domiciled in Ireland and Luxembourg. This is overwhelmingly capital from institutions; the larger size of retail transactions in offshore funds suggests the underlying investors are higher net worth individuals.


