UK investors pulled capital out of bond funds in April 2025 at the fastest rate since the onset of the pandemic in April 2020, according to the latest Fund Flow Index from Calastone, the largest global funds network. Investors withdrew a net £1.24bn from fixed income funds in April, the second consecutive month of strong selling.
Bond fund outflows in April were the second-worst month on record
The April outflow was a long way short of the £3.37bn outflow in April 2020 as lockdowns swept the world, but that month was marked by historic disruption as liquidity evaporated and central banks scrambled to stabilise the system. Even so, April 2025 saw net selling 46% higher than the third worst month (September 2024). It also follows a very weak March which was itself the fourth worst month on record for the sector.
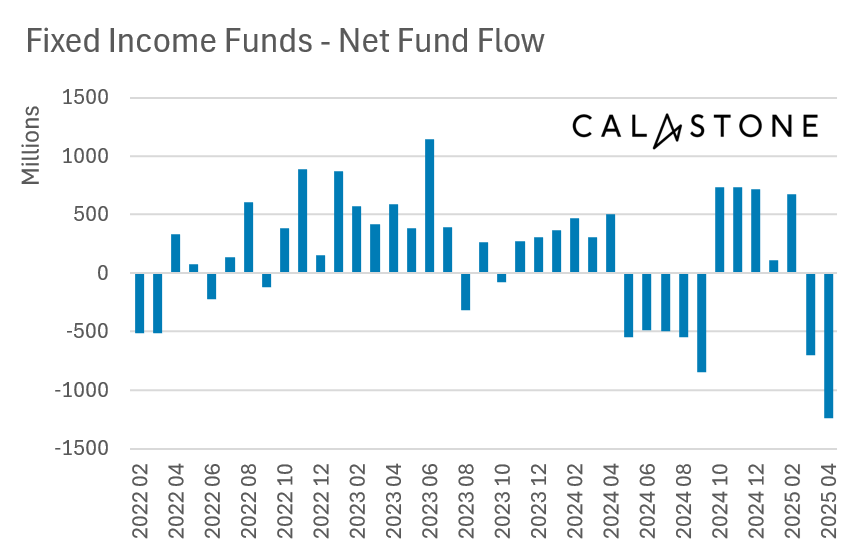
Notably, April’s outflows were focused on funds investing in sovereign fixed income. These suffered net selling of £621m, by far the worst on record for sovereign bond funds.
Safe-haven money market funds benefited strongly
Money market funds, whose prices tend to be very stable, saw inflows of £589m, the fifth best month on record. The last three months have seen the strongest inflows to money market funds than any other three-month period in Calastone’s comprehensive data.
Edward Glyn, head of global markets at Calastone said: “Bond markets have whipsawed as investors try to price the impact on the global economy of ever-changing US policy announcements on trade as well as threats, both made and rowed back on, to undermine the independence of the US Federal Reserve. The US dollar is also under pressure, harming confidence in US government bonds, which form by far the largest share of the global sovereign bond market. The turmoil in US bond markets has in turn pressured yields around the world. With most tariffs currently on hold and the Fed’s independence seemingly secure, markets rallied in the second half of April – bond yields were significantly lower (pushing up prices) at the end of the month than in the week following ‘Liberation Day’.”
Equity fund inflows remained solid, with investors buying US market dip
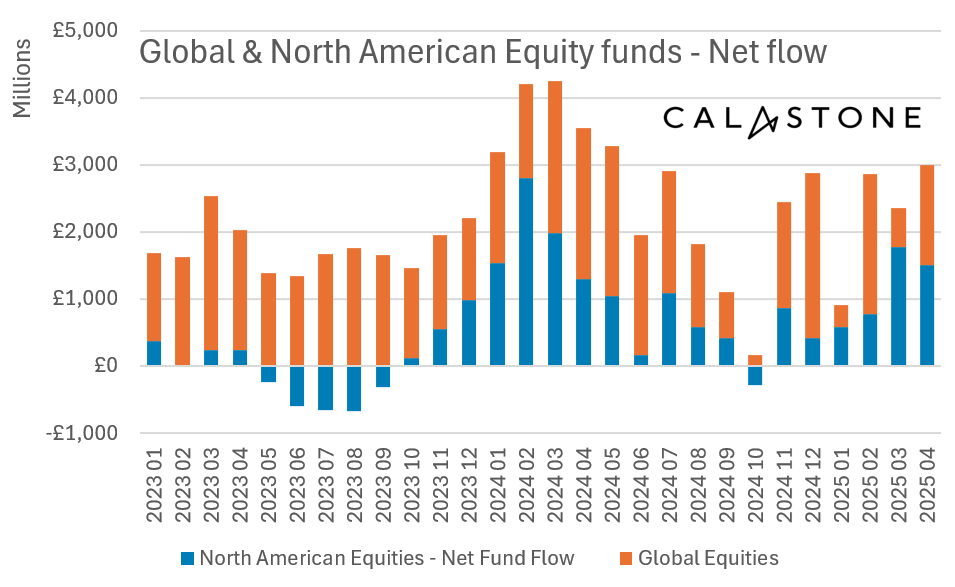
The story for equity funds is very different. Investors added a net £1.52bn to their equity fund holdings in April, the fourth consecutive month of improvement. The biggest beneficiaries, perhaps paradoxically, were funds investing in North America (mainly the US), with a particular focus on index-tracking funds. Investors added a net £1.51bn to North American equity funds, with the net buying beginning in earnest on 8th April, just as the market began to speculate that President Trump was about to reverse his Liberation Day tariff schedule. Global funds, which are heavily weighted to US equities, also saw strong inflows, totalling a net £1.48bn.
There was, however, strong net selling of emerging market and Asia-Pacific equity funds with outflows of £591m and £534m respectively, the worst month on Calastone’s record for emerging markets. European equity funds saw net selling of £145m.
UK-focused equity funds saw sharp reduction in outflows
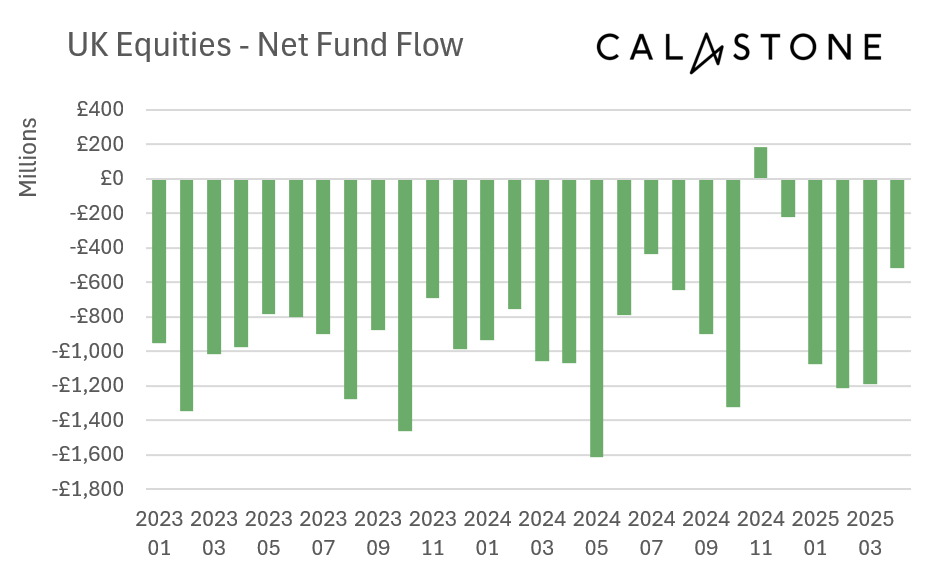
UK-focused equity funds also saw further net selling, but at £521m it was the ‘least bad’ since July 2024 if we ignore October and November 2024, when trading patterns were heavily distorted by capital gains tax changes.
Edward Glyn added: “Bond and equity markets rallied more or less in tandem in the second half of April so it seems strange that investors in fixed income funds took such a different view from those in equities. There are clearly concerns about government finances if the global economy slows as much as many are now predicting and this may be a factor. Equally the bond market seems to be the one force that has so far been able to constrain the wildest instincts of the US president and the associated volatility that entails. This may be why investors are pulling out of bond funds and parking so much cash in safe-haven money market funds.
“The interest in US equities in April may simply be a ‘buy the dip’ tactic. Certainly inflows tailed off at the end of the month by which time the US stock market had recovered half the peak-to-trough losses it had suffered between the middle of February and early April.
“The slowdown in outflows from UK-focused funds reflects the relative outperformance of the UK market year-to-date. Although it is still below its February peak, the UK market is up so far in 2025. This has not been enough to tempt UK investors into a wholesale reassessment of their negative view on UK shares, however.
Emerging markets are vulnerable to financial instability and are heavily weighted to China. With China singled out for Trump’s harshest tariffs, concerns over economic growth are clearly the reason for investors to draw down their emerging market and Asia fund holdings.”
Methodology
Calastone’s Fund Flow Index (FFI) is the most widely followed, most timely, and most comprehensive tracker of fund flows in the UK. Because it relies on real trading data by investors, rather than survey opinion, it is also the most accurate.
The FFI analyses millions of buy and sell orders in individual funds every month from millions of UK-based investors. More than 85% of all UK fund flows by value pass across Calastone’s network. To avoid double-counting, however, the analyst team excludes funds of funds. Totals are scaled up for Calastone’s market share.
Net fund flows are the difference between the value of investor buy orders and investor sell orders. The value of buy orders and the value of sell orders are both very large – the net flow is typically very small in comparison to this large amount of trading activity.
Calastone only measures orders from UK-based investors into funds domiciled in the UK. Note that this has nothing to do with where the underlying assets are invested – a UK-domciled fund may invest in Japanese equities, Australian fixed income, a global portfolio of mixed assets, or just UK equities. The fund sector information breaks this down in detail.
Calastone uses the FE Fundinfo dataset to assign characteristics such as fund sector, or active v passive to each fund. Before December 2024 Calastone used Lipper for this function. Calastone has restated all historic data with the new FE Fundinfo data to ensure consistency. The new FE FundInfo provides enhanced coverage, and now includes many funds that are not classified by Lipper. The new FFI is therefore even more comprehensive than before, and the historic data now reflects this improvement. Calastone’s analysts do not judge there to be any material differences in the trends revealed using FE FundInfo classifications v Lipper, though there are minor points of detail that differ in individual months.
Calastone also calculates an index value to enable comparison between different asset classes and fund sectors of different sizes. A reading of 50 indicates that buy and sell orders are equal in value. A reading above 50 means capital is flowing in and a reading below 50 means it is flowing out. In other words, a net inflow of £1m would score much more highly if it is the difference between, say £10m of buys and £9m of sells than if it was the difference between £100m of buys and £99m of sells.