After running for cover during January’s financial market turbulence, UK investors were more positive in February, according to the latest Fund Flow Index from Calastone, the largest global funds network. They added a net £1.09bn to their equity-fund holdings during the month, having been net sellers in January. Rising bond markets also prompted the largest inflows to fixed income funds since June 2023, making February the third best month on Calastone’s 10-year record for the sector.
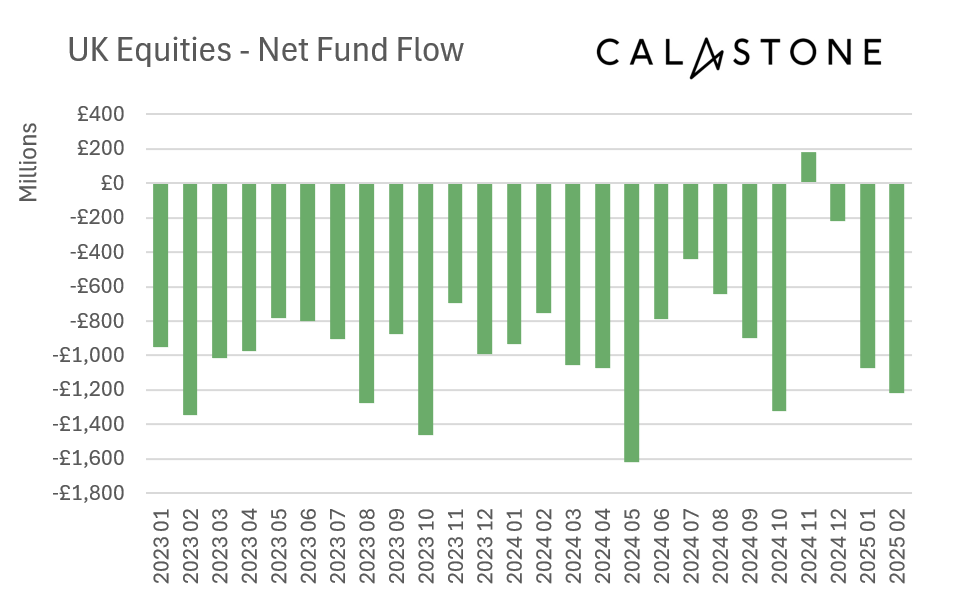
UK-focused funds saw accelerating outflows – the sixth worst month on record; investors increasingly focusing on the US
Optimism on equities was not indiscriminate, however. UK-focused funds endured another bad month, shedding a net £1.22bn, the sixth worst month on record. The outflow came despite the UK index outperforming global markets in February, ending the month up by 1.6%, compared to a 0% for the wider world. Japan, Asia-Pacific, Emerging Markets, European and specialist sector funds all saw outflows too, though these (except Asia-Pacific) were at relatively low levels. The big winners, once again, were Global and North American funds, which garnered net inflows of £2.09bn and £770m respectively. Given the 60% weighting of US equities in typical global funds, inflows to this sector are also a vote for the US stock market.

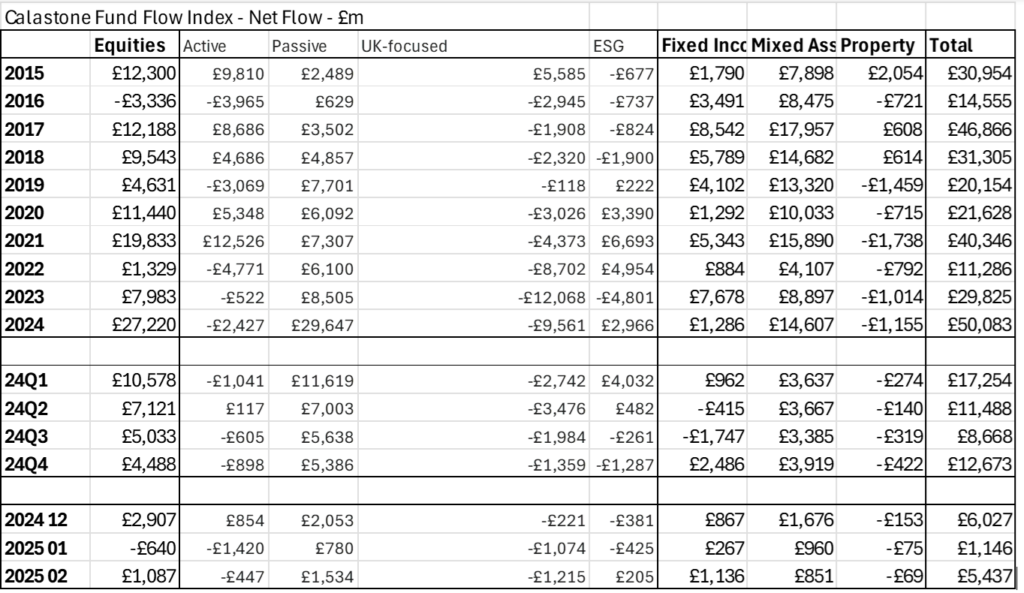
This follows a longer-term trend. Since 2020 these two sectors alone have enjoyed inflows of £100.88bn, compared to £32.6bn of outflows across all other equity sectors (thanks to selling of UK equities). It is a consistent pattern. Since the beginning of 2024, Global and North America alone have seen net inflows of £35.2bn, while UK-focused funds have shed £11.85bn. Most other fund sectors have seen also seen some inflows (except Asia-Pacific and Greater China), but at a fraction of the pace of Global and North American ones – collectively just £4.29bn since January 2024. Given that fund flows are structurally positive as investors save for the long term, this pattern implies there is an outright switch underway from the UK to global and US funds.
Third-best month on record for fixed income funds – investors locking into high yields
Fixed income funds had an exceptionally strong month – at £1.14bn, the third best for inflows on record. Investors bought avidly to lock into the post-GFC highs yields reached in January when markets convulsed over reignited fears of inflation caused by the outbreak of trade wars. Within this overall total, high-yield bond funds had their best month on record, with £305m of inflows, while inflows to sovereign bonds of £201m were almost double the monthly average for the last year.
Money market funds saw inflows decline to their lowest level since June 2024, if we look beyond the distortions caused by the Chancellor’s autumn budget. The £140m inflow is still well above pre-Covid times when the era of low interest rates deterred investors from cash funds but money market inflows are on a declining trend as central banks cut policy interest rates.
Edward Glyn, head of global markets at Calastone said: “February’s global equities marched investors to record heights and then marched them back down again, leaving them nursing losses for the month. Investors were clearly wary – inflows to equity funds were around half the monthly average for the last year. The fact that the UK stock market bucked the trend was seemingly immaterial to investors clearly bent on switching steadily out of domestically focused funds. UK investors are still structurally overweight UK equities relative to the UK’s share of global market capitalisation, but the relentless purchase of global and North American funds is only increasing their exposure to the US market, and in particular its Magnificent 7 stocks. This is not without risk, as the volatility in share prices of these big tech stocks in recent months shows.”
“The surge in interest in bond markets was clearly spurred on by the buying opportunity presented by the exceptionally high yields on offer in January. Bond markets have calmed considerably since then, but investors who bought when yields peaked are already sitting on capital gains and have locked in at very attractive prices. If inflation once again slips its chains and makes another run for it, this rally could prove short-lived.”
Methodology
Calastone’s Fund Flow Index (FFI) is the most widely followed, most timely, and most comprehensive tracker of fund flows in the UK. Because it relies on real trading data by investors, rather than survey opinion, it is also the most accurate.
The FFI analyses millions of buy and sell orders in individual funds every month from millions of UK-based investors. More than 85% of all UK fund flows by value pass across Calastone’s network. To avoid double-counting, however, the analyst team excludes funds of funds. Totals are scaled up for Calastone’s market share.
Net fund flows are the difference between the value of investor buy orders and investor sell orders. The value of buy orders and the value of sell orders are both very large – the net flow is typically very small in comparison to this large amount of trading activity.
Calastone only measures orders from UK-based investors into funds domiciled in the UK. Note that this has nothing to do with where the underlying assets are invested – a UK-domciled fund may invest in Japanese equities, Australian fixed income, a global portfolio of mixed assets, or just UK equities. The fund sector information breaks this down in detail.
Calastone uses the FE Fundinfo dataset to assign characteristics such as fund sector, or active v passive to each fund. Before December 2024 Calastone used Lipper for this function. Calastone has restated all historic data with the new FE Fundinfo data to ensure consistency. The new FE FundInfo provides enhanced coverage, and now includes many funds that are not classified by Lipper. The new FFI is therefore even more comprehensive than before, and the historic data now reflects this improvement. Calastone’s analysts do not judge there to be any material differences in the trends revealed using FE FundInfo classifications v Lipper, though there are minor points of detail that differ in individual months.
Calastone also calculates an index value to enable comparison between different asset classes and fund sectors of different sizes. A reading of 50 indicates that buy and sell orders are equal in value. A reading above 50 means capital is flowing in and a reading below 50 means it is flowing out. In other words, a net inflow of £1m would score much more highly if it is the difference between, say £10m of buys and £9m of sells than if it was the difference between £100m of buys and £99m of sells.