
Global funds industry – fighting the bear
Trading volumes – buy, try, fly, repeat
Focus on equities – flight to safety
Equity sector trends – risk off
Focus on fixed income – no refuge
Focus on mixed assets & property
Viewpoint – by Julien Hammerson, CEO of Calastone
2022 and 2020 saw the most volatile market conditions in a decade, according to the Vix Volatility Index. 2022’s convulsions were a direct consequence of policy medicine administered in 2020 at the onset of the pandemic. In that year, the extreme market disruption that accompanied the outbreak of Covid-19 subsided steadily over the months that followed as markets were sedated by vast sums of central-bank liquidity. That easy money inflated bubbles in equities, bonds, property and private assets. When geopolitical strife ignited an energy crisis and inflation took off around the world in 2022, the Federal Reserve and its peers were forced to embark on a rate-hike scramble to head off the threat of an inflationary spiral – and those bubbles ruptured. Higher bond yields crushed riskier assets the most – growth equities, long-dated bonds, high-yield debt, private equity – while defensive, income-generating stocks, and those that benefited from high energy prices held their own.
![]()
2022’s Bear market delivered the biggest fall in AUM since Global Financial Crisis
The bear market delivered the worst year for the global mutual funds industry since the Global Financial Crisis. Assets under management peaked globally at $70.9 trillion at the end of 2021[1], but had fallen by 21% to $56.2 trillion by the end of September 2022. This was almost entirely due to sharply lower asset prices – the MSCI World (an index of equity markets) fell by 26.5% between Q1 and Q3, and fixed income indices were also markedly lower. Outright fund outflows also played a small role, in contrast to the usual process of steady accumulation of savings. In value terms 2022’s decline in AUM was the largest the industry has experienced on record, though in percentage terms, the 26% fall between Q1 2008[2] and Q2 2009 was larger. Lower AUM naturally bring lower fees too, meaning the elimination of cost and friction, Calastone’s raison d’etre, is even more important for fund managers.
[1] Source: ICI, earliest data available
[2] Source: ICI
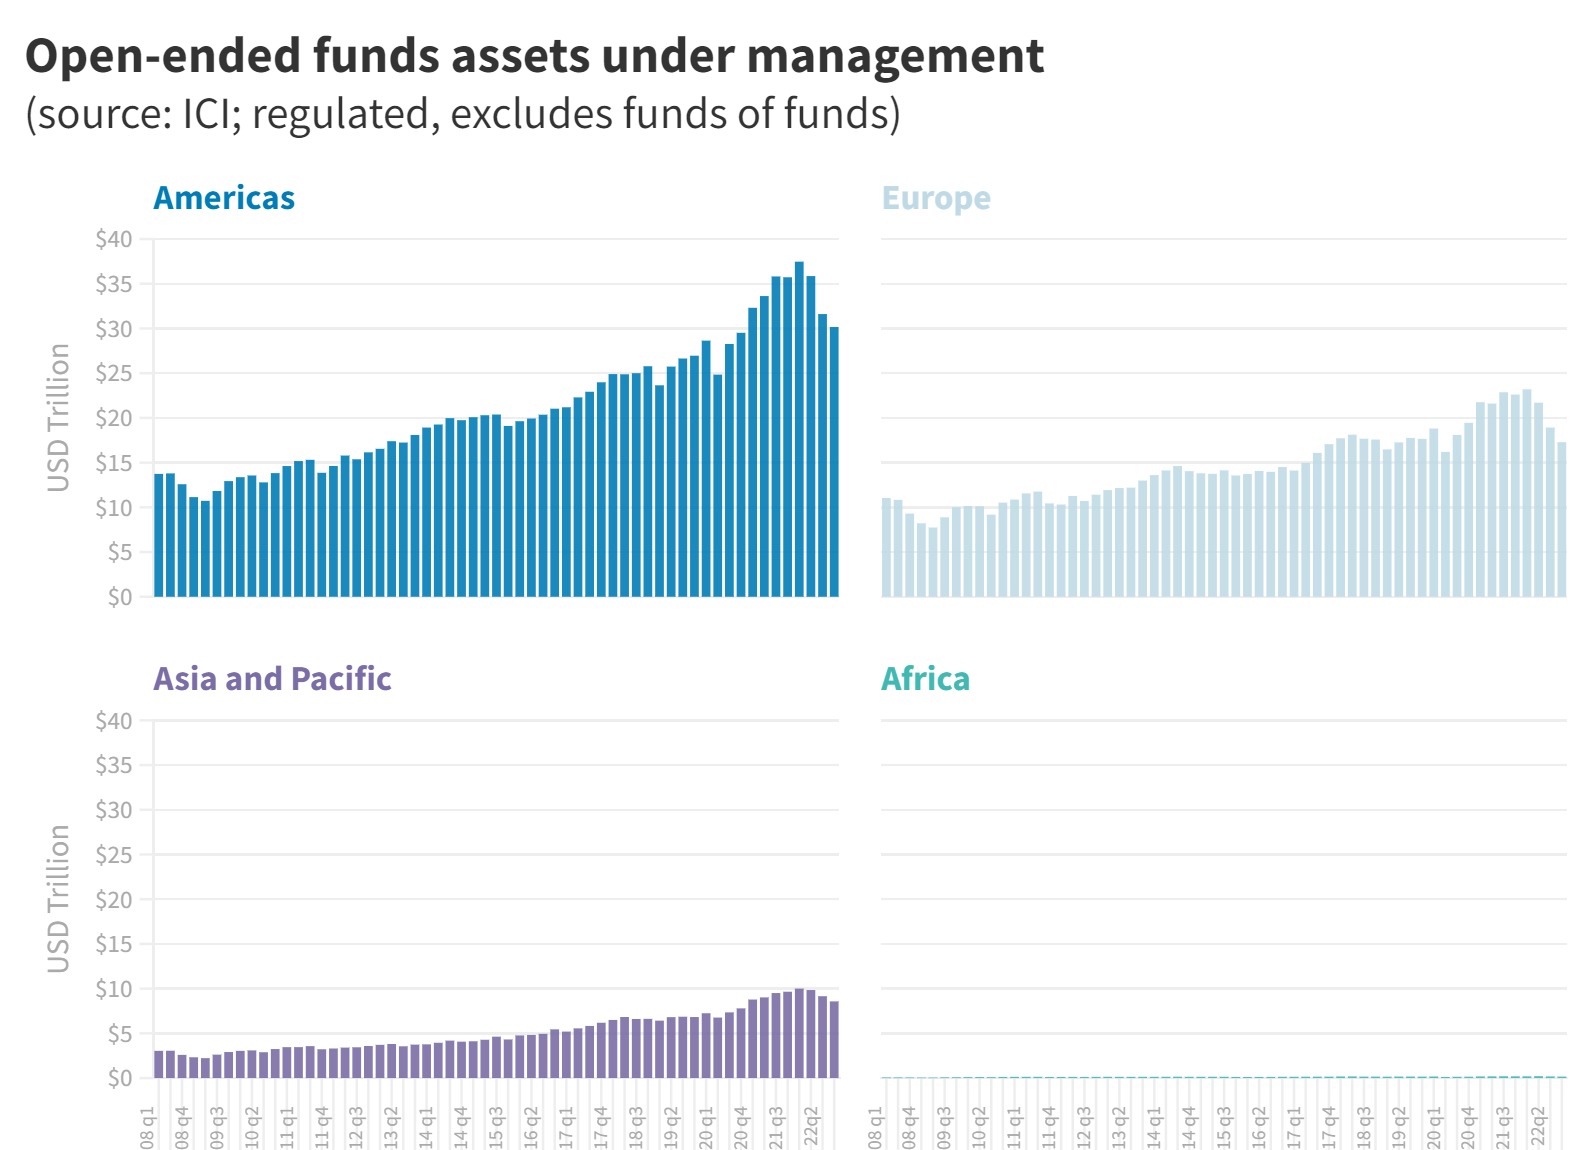
Home-market bias exerted a significant influence on regional AUM
The impact was most marked in the UK and Europe, where assets under management measured in US dollars fell by over a quarter. This reflects a natural home-market bias in portfolios and the effect on their dollar valuation caused by the sharp fall in the value of the pound, euro and other European currencies during the year. Measured in local currencies, which better reflects the lived experience of each investor, the value of assets in almost every country in Europe (including the UK) fell less than the 21% decline in US assets under management. Seen through this lens, that same home-market bias was helpful, because European equities outperformed their US counterparts. Moreover, a significantly larger weighting to fixed income funds around Europe (though not among UK investors) was also part of the story. These fell less than global equities in the first nine months of 2022.
Meanwhile, the home-market bias and high equity weighting in US portfolios meant heavier exposure to the overvaluation of US tech companies that have seen their values crash since the bear market began.
In dollar terms, AUM in Asia-Pacific (which includes Australia) fell by one seventh between January and September 2022, with the biggest decline in Japan, thanks mainly to the weak yen. A large weighting in these markets (including Australia) to both financials that benefit from rising interest rates and resources companies that have enjoyed high commodity and energy prices helped support AUM in the region.
By the middle of January 2023, stock and bond markets had rebounded from their September 2022 lows, suggesting AUM will have clawed back around $7 trillion of its losses, or around half the decline suffered in the first nine months of last year.
Asia Pacific ex Japan’s investors increased their share of the global mutual fund pie in 2022
US investors maintained their share of global assets at the expense of those in Europe, the UK and Japan, while those in China, Australia and some other parts of Asia increased theirs. At the end of September 2022, US investors owned 48.2% of the world’s mutual fund assets[3]. This was almost unchanged since the end of 2021, mainly because the strength of the US dollar offset the larger decline in US asset prices than in many other parts of the world. Fund outflows were also smaller in the US than they were in Europe, despite the former being a significantly larger mutual fund market. Europe’s share of global assets fell by just under two percentage points to 30.8%, while those in Asia-Pacific ex Japan[4] rose 1.3 percentage points to 15.3%. Chinese investors have continued their steady accumulation and now own 5.8% of global mutual fund assets (up from 5.0% at the end of 2021), while those in Australia saw their share rise to 4.0% (up from 3.7%).
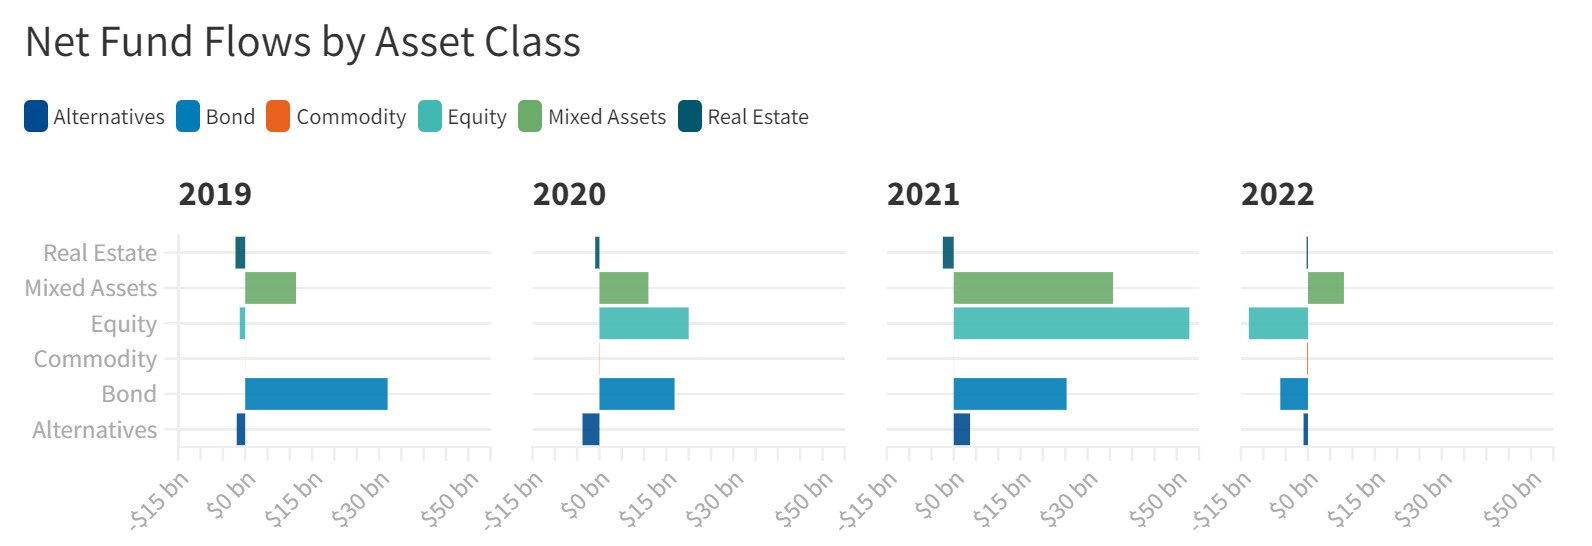
Investors around the world have very different asset allocations
Asset preferences vary widely. Globally pure equity funds account for 44% of AUM, but this share is as high as 56% in the US and as low as 32% in Europe[5]. The UK is more like the US, with half of AUM in equities, though by the time the equity portion of mixed asset funds is factored in, the UK and the US have a broadly similar exposure to shares. Europeans also have a notable preference for mixed asset funds, so their true equity weighting is higher than pure equity funds suggest, but it remains well below the level in the US. In Asia-Pacific markets outside Australia money market funds absorb a larger share of savings than elsewhere in the world, especially in China.
Globally, fixed income makes up exactly one fifth of total AUM and property 2%. Europeans and Australians favour property funds much more than the global average.
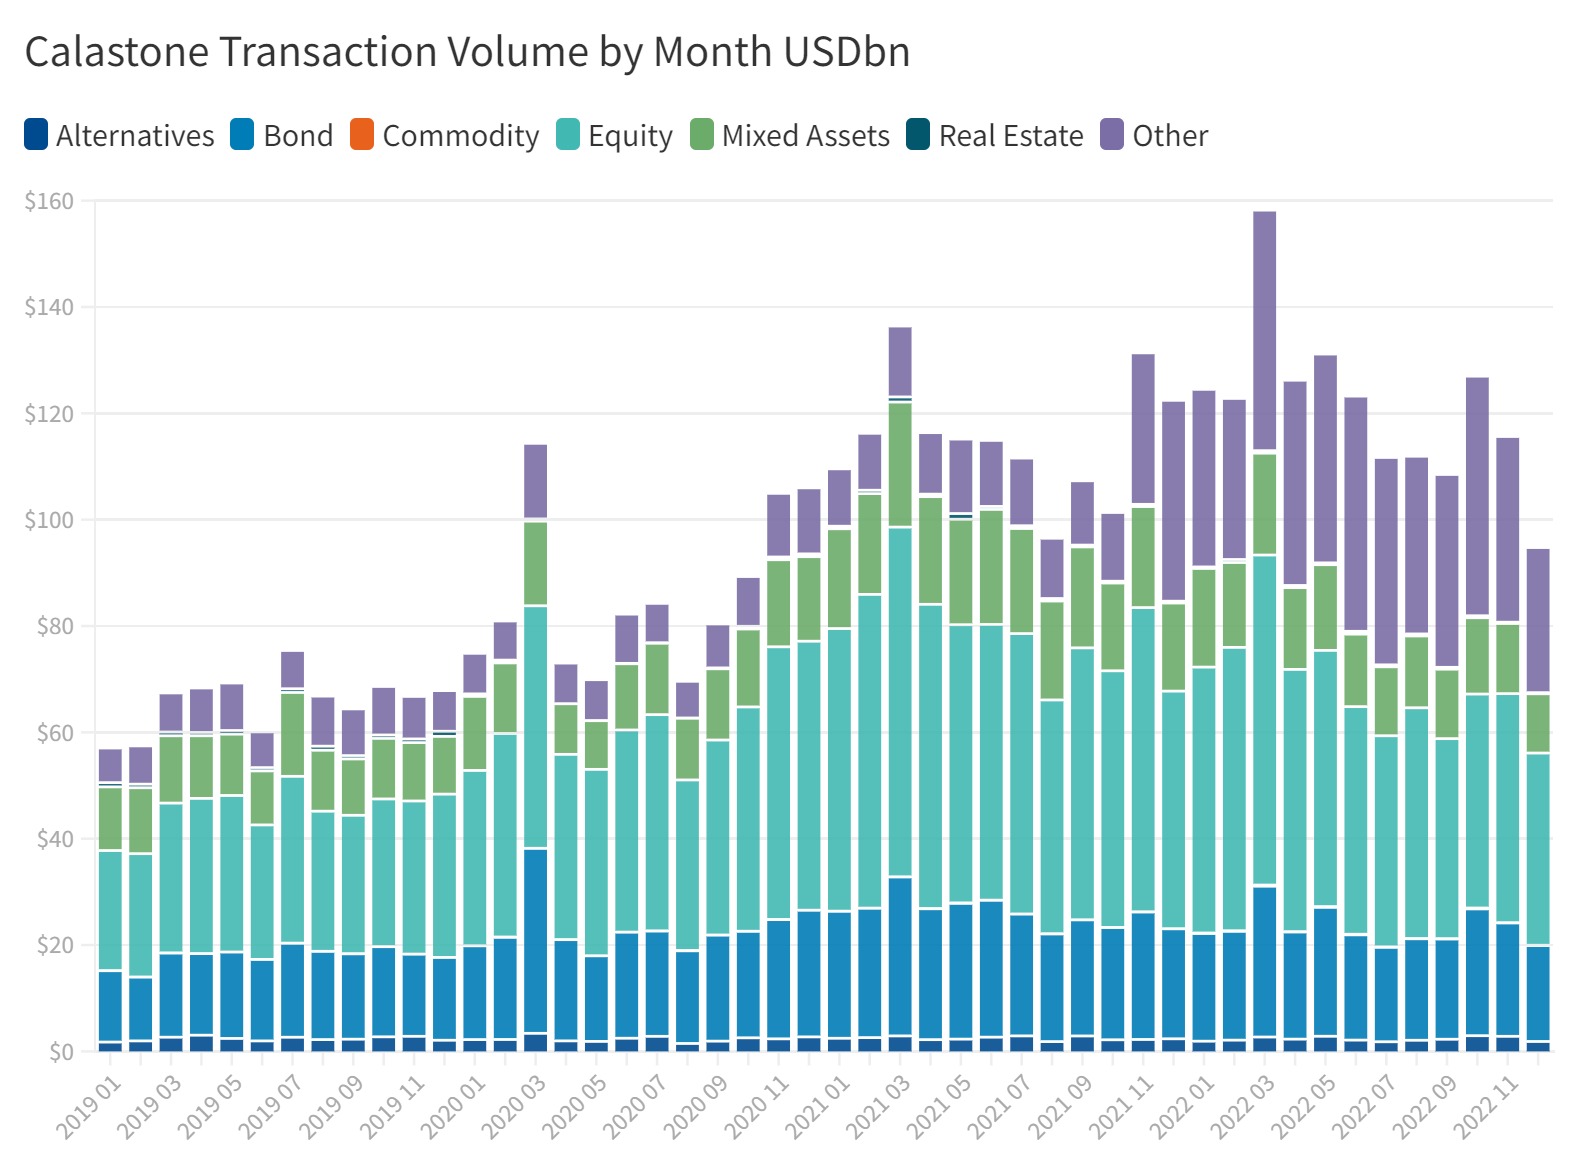
Turnover is high when markets are volatile
More volatile market conditions tend to mean greater fund turnover as investors assess and reassess their holdings in the light of the changing economic and financial environment, but the relationship is not straightforward. Certainly, we saw a very big increase in turnover across our global network in 2020, across almost all asset classes, even after allowing for the rapid growth in our business. Turnover remained very high in both 2021 and 2022, compared to the pre-pandemic years of quieter markets, but in each of fixed income, equities, mixed assets and real estate, turnover was higher in 2021 when markets were in their bubble phase and volatility had subsided a little, than it was in 2022’s highly volatile bear market. Most of this was of course due to lower asset values, but there was also less activity too. Across those four asset classes, we handled millions of orders with a value of US$976bn in 2022, down from $1.15 trillion in 2021.
The bear market drove buyers away rather than provoking mass selling
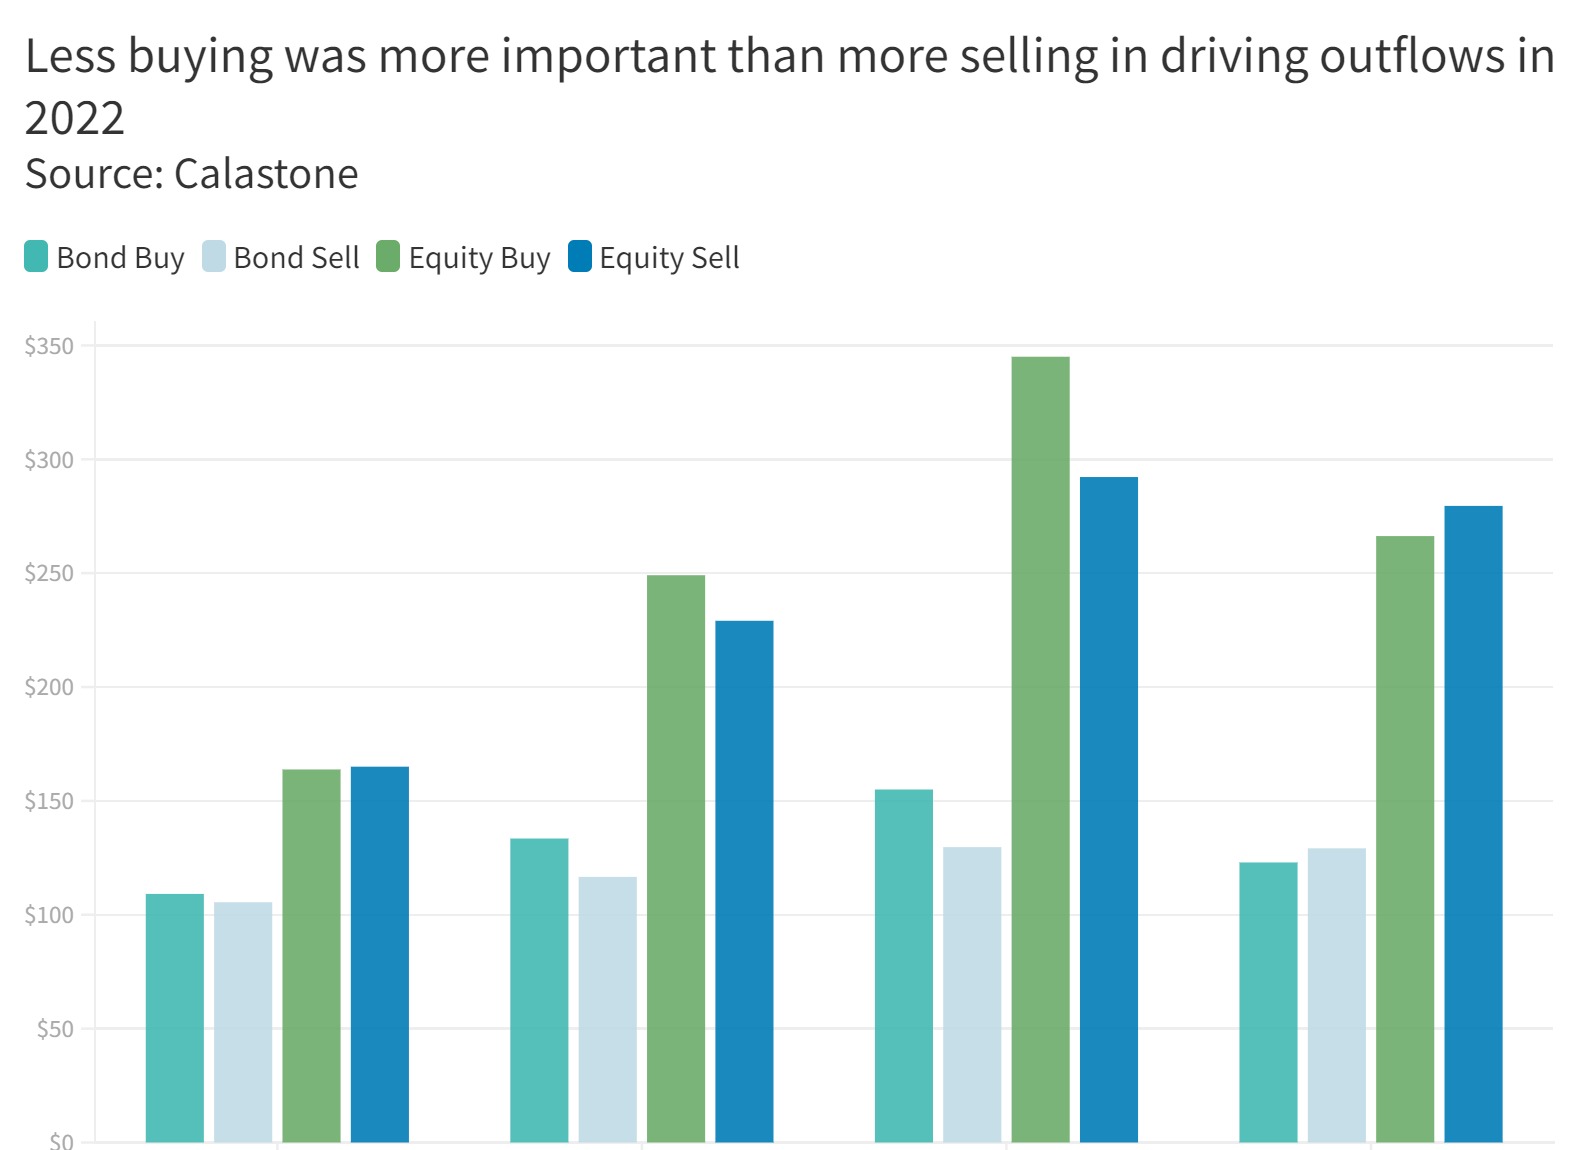
In 2020, the sharply higher turnover we handled resulted from a similar increase in both buying and selling activity reflecting the different phases of crisis and policy response as investors worked out what it all meant for asset values. In 2021, however, sharply higher buying activity was the principal driver of higher transaction volumes as investors chased the asset bubble higher. As boom turned to bust in 2022, that excess buying fell away while the volume of sell orders dipped less significantly. Overall turnover remained high by comparison to 2019 and before, but in equity funds for example, nine tenths of the 14% volume reduction across our network year-on-year was down to lower buy orders.
In other words, the bear market did not drive a rush for the exits, but rather chased buyers away, while provoking a high level of switching between funds. This still resulted in net outflows of capital but not because of a big increase in sell orders.
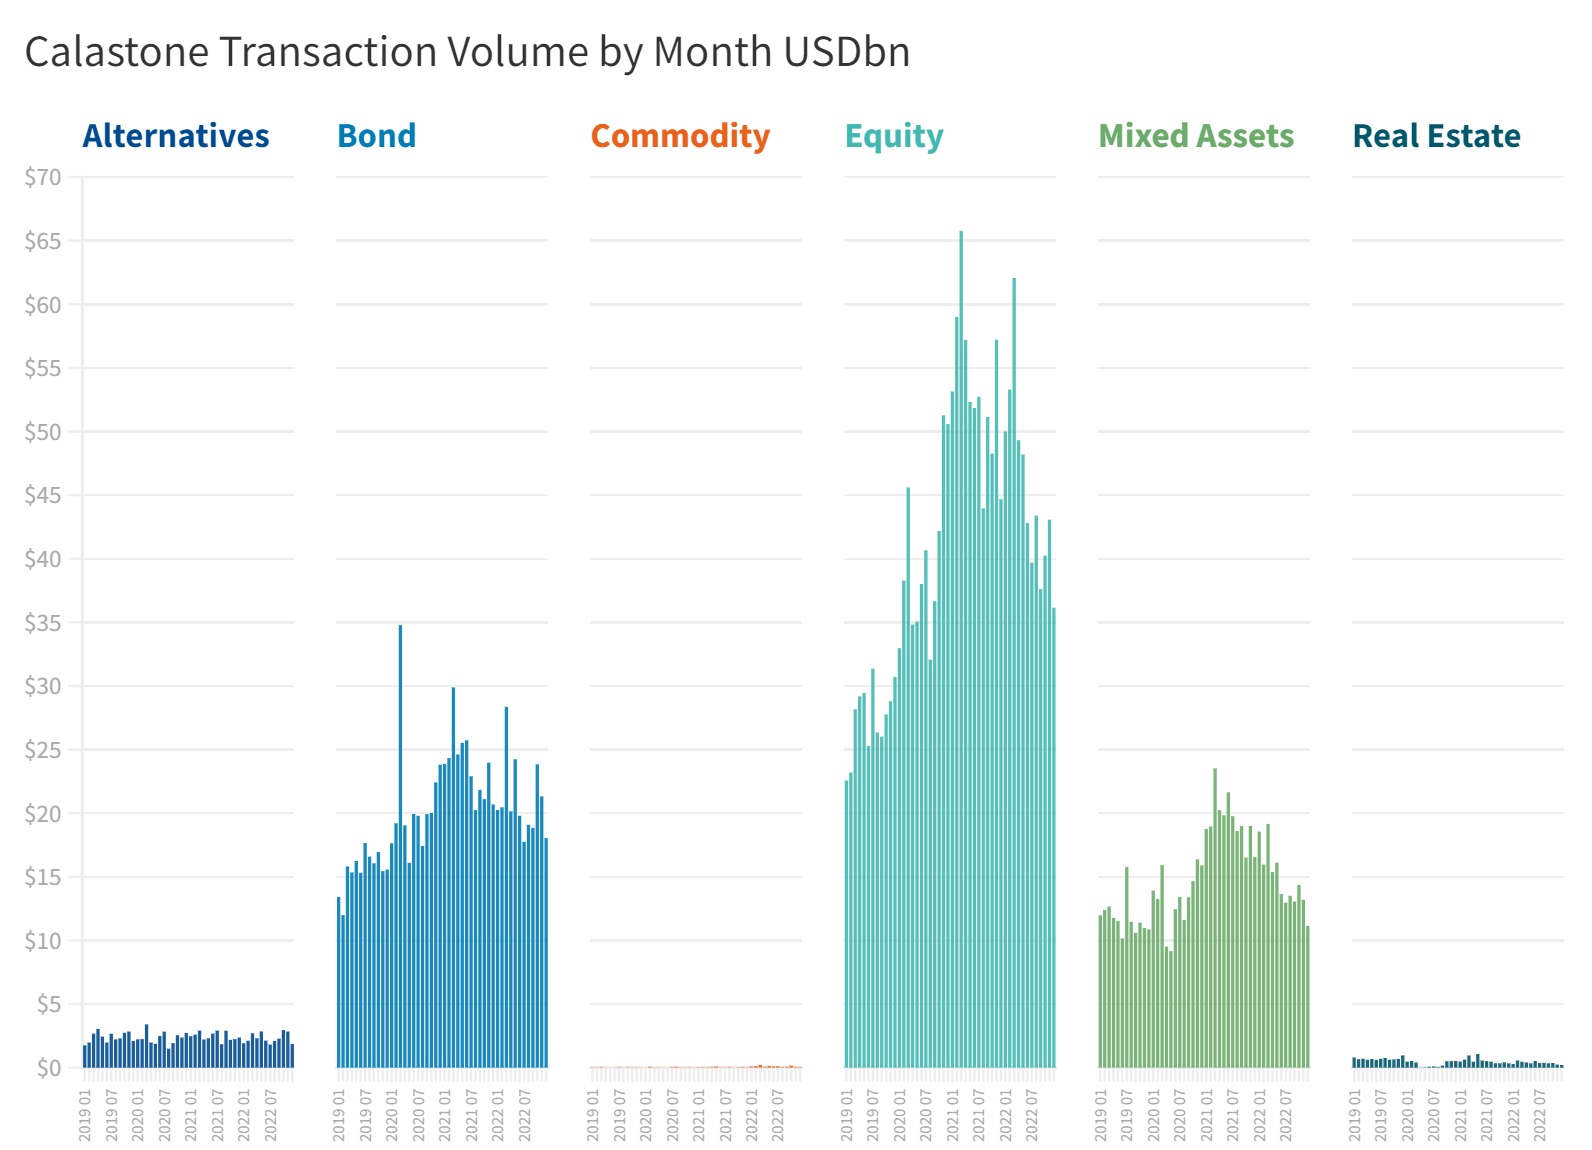
Trading intensity is similar between equities and fixed income
![]()
Broadly speaking, the equity and fixed income fund transaction volumes we handle on our network are roughly proportionate to the value of assets under management globally. In other words, equity fund turnover over time is around twice the size of fixed income fund turnover. This means trading intensity is similar in both asset classes.
In 2022, equity volumes fell slightly more than fixed income (-14.3% v -11.5%). Mixed asset fund volumes fell significantly more (-24%) perhaps because the correlation between both fixed income and equity prices has reduced the traditional diversification value of a balanced portfolio and fund management groups have reduced marketing activity as a result. Meanwhile, a sharp drop in real estate fund transactions is partly due to market conditions, but also reflects limits on redemptions imposed by many of the funds operating in the UK.
The bear market in 2022 resulted from the mechanically inevitable repricing of assets of all kinds that occurs when bond yields rise. This is baked into the maths of asset valuation through the process of discounting future cash flows into present-day money.
We have also seen markets take much greater heed of differing levels of risk. This is evident in bond markets – yield spreads between riskier borrowers like Italy and the safest bets like Switzerland, or between weaker corporates and the safest blue chips have expanded sharply. Uncertainty demands a premium. And it has shown up in equity markets too – risky tech companies have crashed in value, while boring-but-safe cash-generative tobacco stocks have proven resilient.
The final element, which affects equity valuations rather than both equities and bonds, is what happens when recession begins to hit profits. As actual and expected cash flows fall, stock values come down too. This has not yet happened and is the risk factor for the year ahead. The interplay between these three factors determines the direction of markets.
2022’s market convulsions prompted investors to draw capital out of mutual funds and park it in the relative safety of cash. It is quite unusual to see outright outflows over a prolonged period of time, because even in times of relatively weak markets there is still a structural bias among households towards the accumulation of savings. Savings ratios rise and fall over the economic cycle – they are higher in times of recession (and are a proximate cause of economic contraction) and lower in boom times. Households must then decide what portion of their new savings to direct towards stocks and bonds and what portion to hold in cash. And of course they must decide if they are happy with the allocation of their existing stock of savings across different asset types.
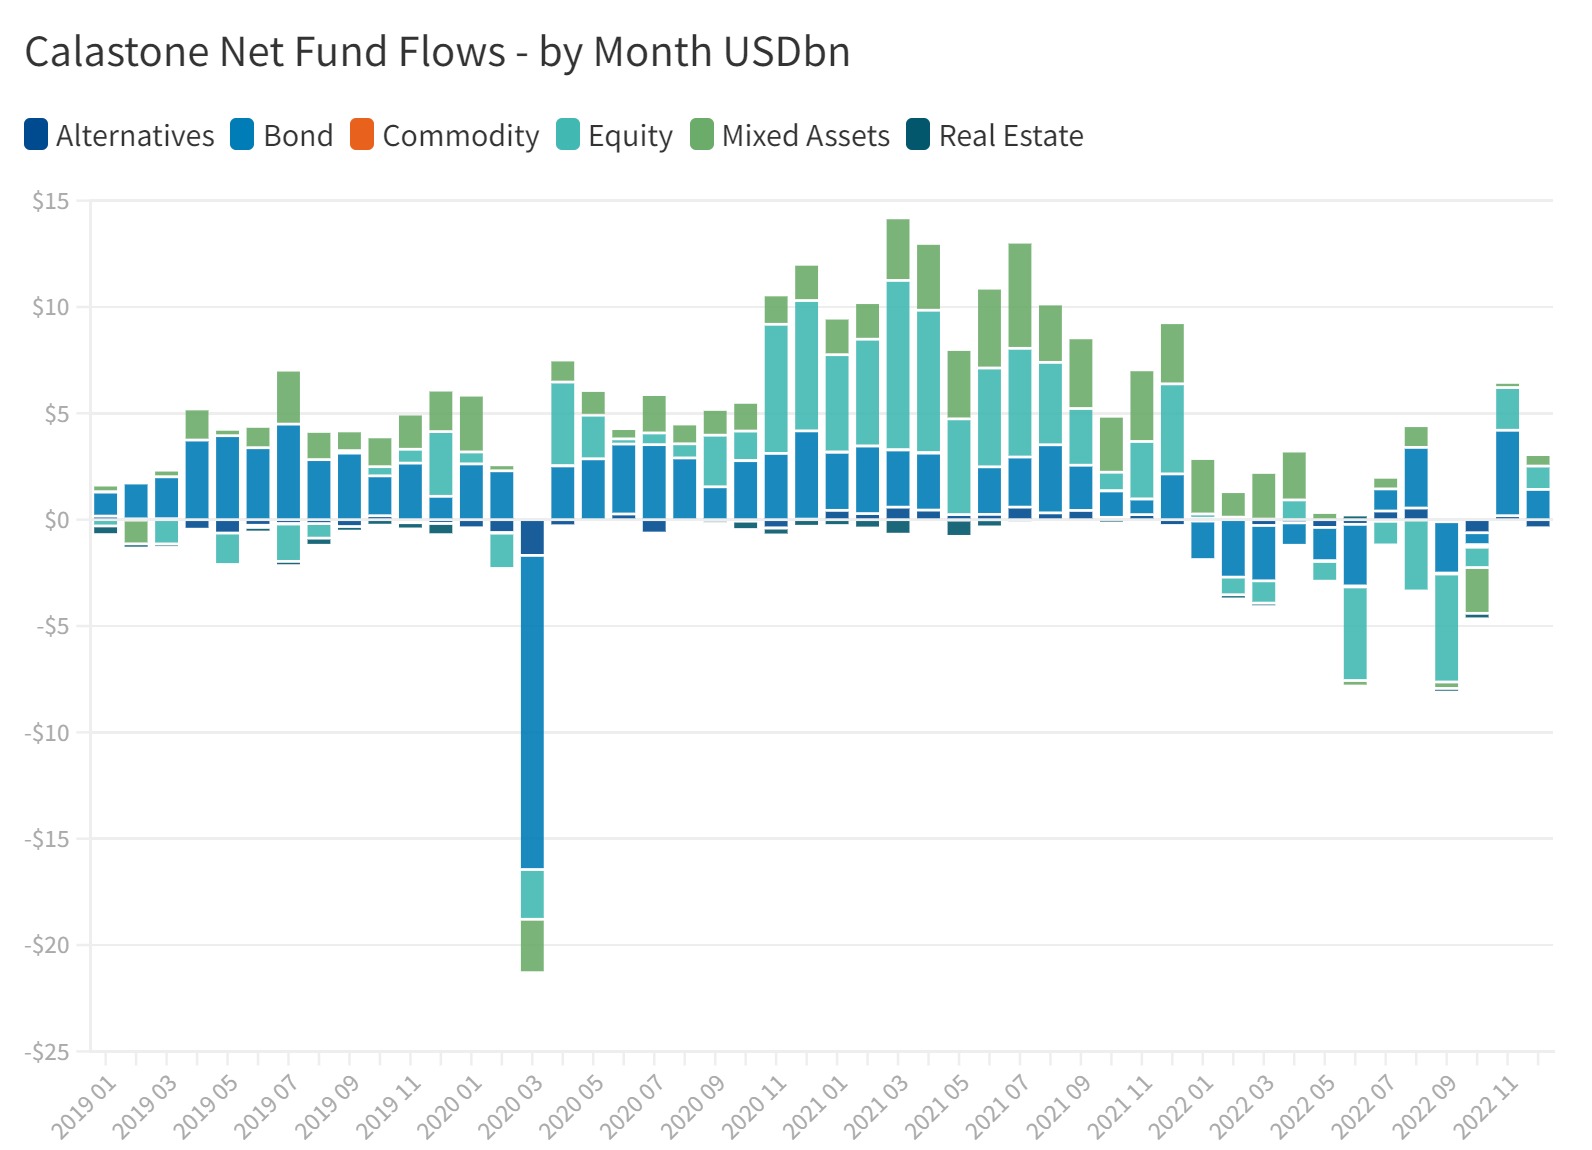
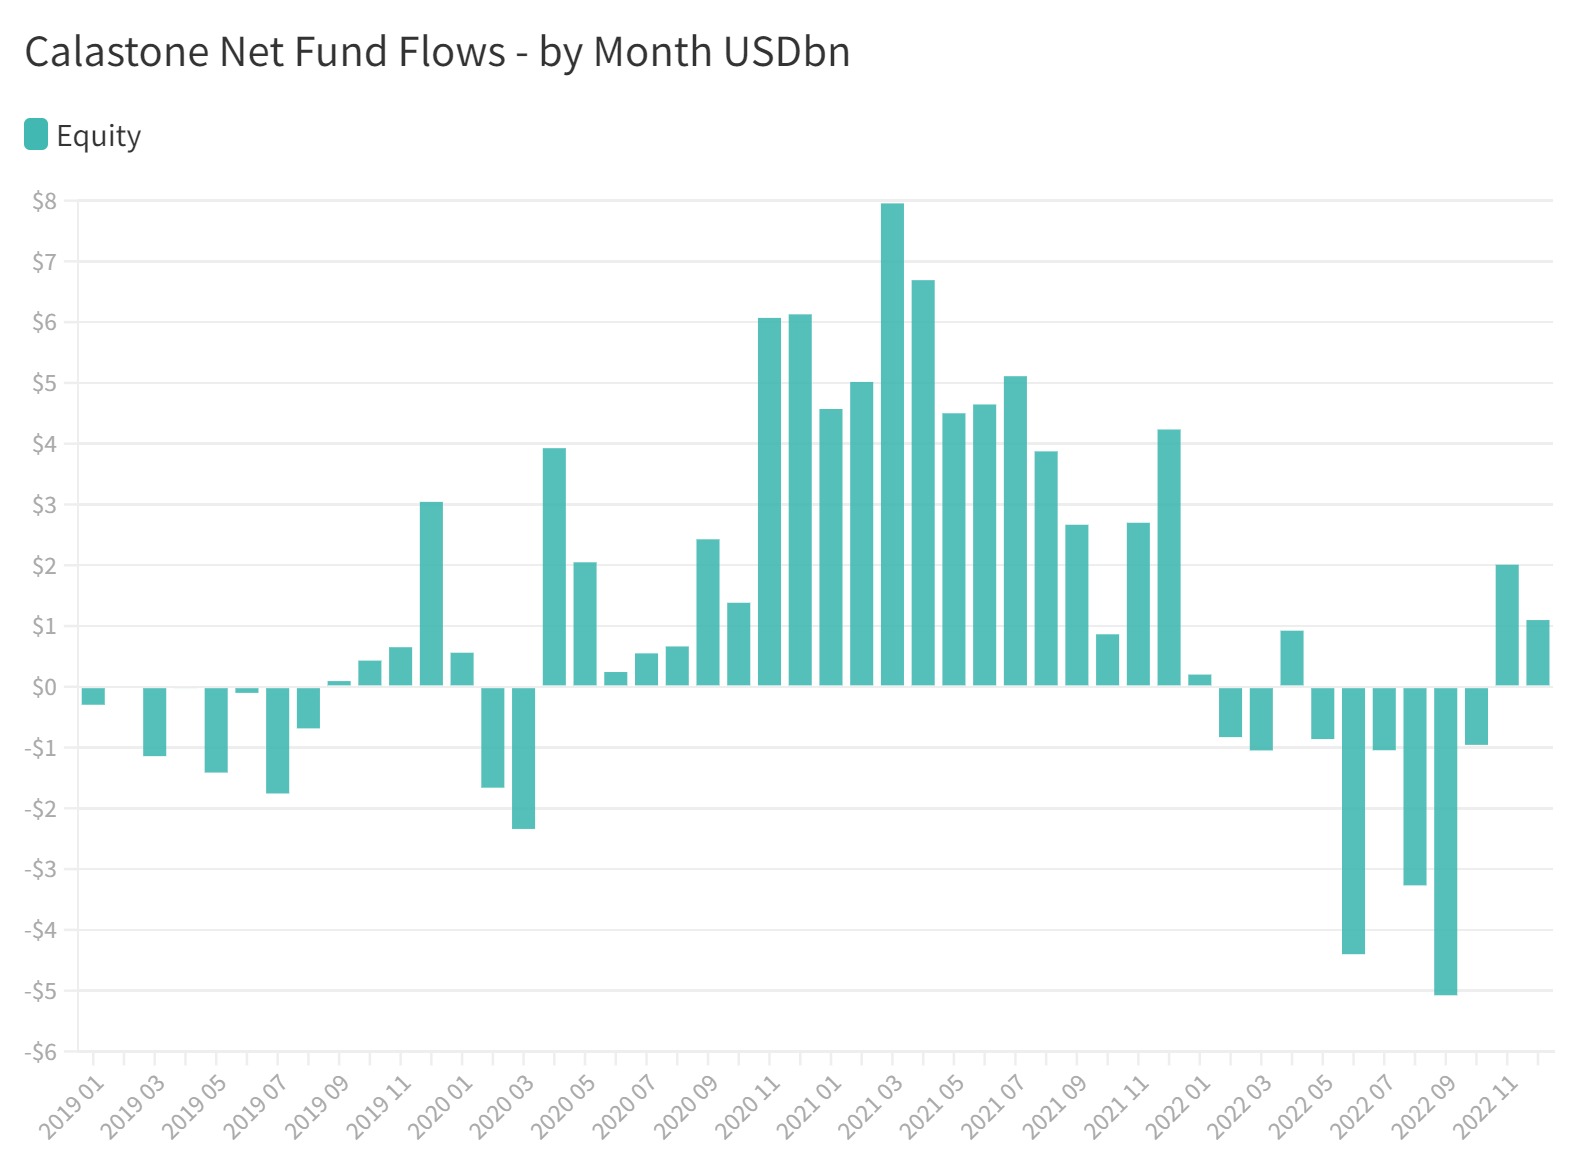
Equity funds saw significant outflows in 2022
Having invested a net $52.8 billion in equity funds in 2021, the buyers’ strike in 2022 meant there was no appetite to risk more capital in volatile markets. The value of equity fund buy orders on our network fell 23% in the year but were down as much as 40% in September as global bond yields surged higher, spooking investors. By contrast, the value of sell orders dropped just 4.5% over the year so the net result was a significant outflow, to the tune of $13.3bn, equivalent to one quarter of the cash that had entered the market in 2021.
Outflows were at their most intense in August and September, accounting for more than half the net redemptions between Q1 and Q3. Hopes that inflation may be peaking and that therefore the rate-hike cycle might end sooner than originally feared prompted bond yields to fall in November and this in turn sparked a rally in equities. Buying remained subdued, but sell orders dropped away leaving a net inflow of $3.1bn in the last two months of the year.
Investors were most pessimistic in Europe and the UK but were more optimistic in Asia-Pacific and Australia
Investors around the world did not behave the same.
European investors were the most negative
Europeans were the most negative on equity funds, as measured by our Fund Flow Index (FFI), which compares net flows to volumes traded and allows an easy comparison across borders where markets are very different in size. European investors withdrew capital from equity funds in every month of the year except November, which saw only modest inflows. European investors’ FFI was a very negative 45.9 for the year[6]. One third of the net outflow came from funds focused on European equities, reflecting the home-market bias in their asset allocation, but Europeans were also big net sellers of funds investing in the US and the UK. From a geographical perspective, only emerging markets funds saw modest inflows of European cash, while from a style perspective, equity income funds, whose underlying investments are relatively defensive, also saw net buying.
UK investor negativity was tempered by enthusiasm for ESG funds
UK investors were also negative. With a FFI reading of 48.5, they remained in better spirits than their European neighbours, however. British investors were exceptionally negative on their own domestic market, but they also pulled capital out of every region, except emerging markets. The one big difference between them and their European counterparts was enthusiasm for global ESG funds, which enjoyed strong inflows during the year and doubtless cannibalised buying of other categories.
Australians were much more optimistic
Australians were in far better spirits than British and European investors, adding capital to their equity funds during the year and generating a positive FFI of 53.7. Their most popular category was global equities, of which one third was directed to global ESG funds, but they remained enthusiastic buyers of domestically focused Australian equity funds too. July and August saw the most inflows, coinciding with the bear-market rally that took place in Q3, but when the bear trap was sprung in mid-August, inflows dried up until markets were calmer again in late October.
Inflows continued elsewhere in Asia-Pacific ex Japan, but at lower levels
In Asia Pacific outside Japan and Australia, investors in Singapore and Hong Kong continued to buy equity funds but inflows were a fraction of the 2021 levels and were focused on regional funds. Taiwanese investors slightly increased their net buying, but inflows remained low.
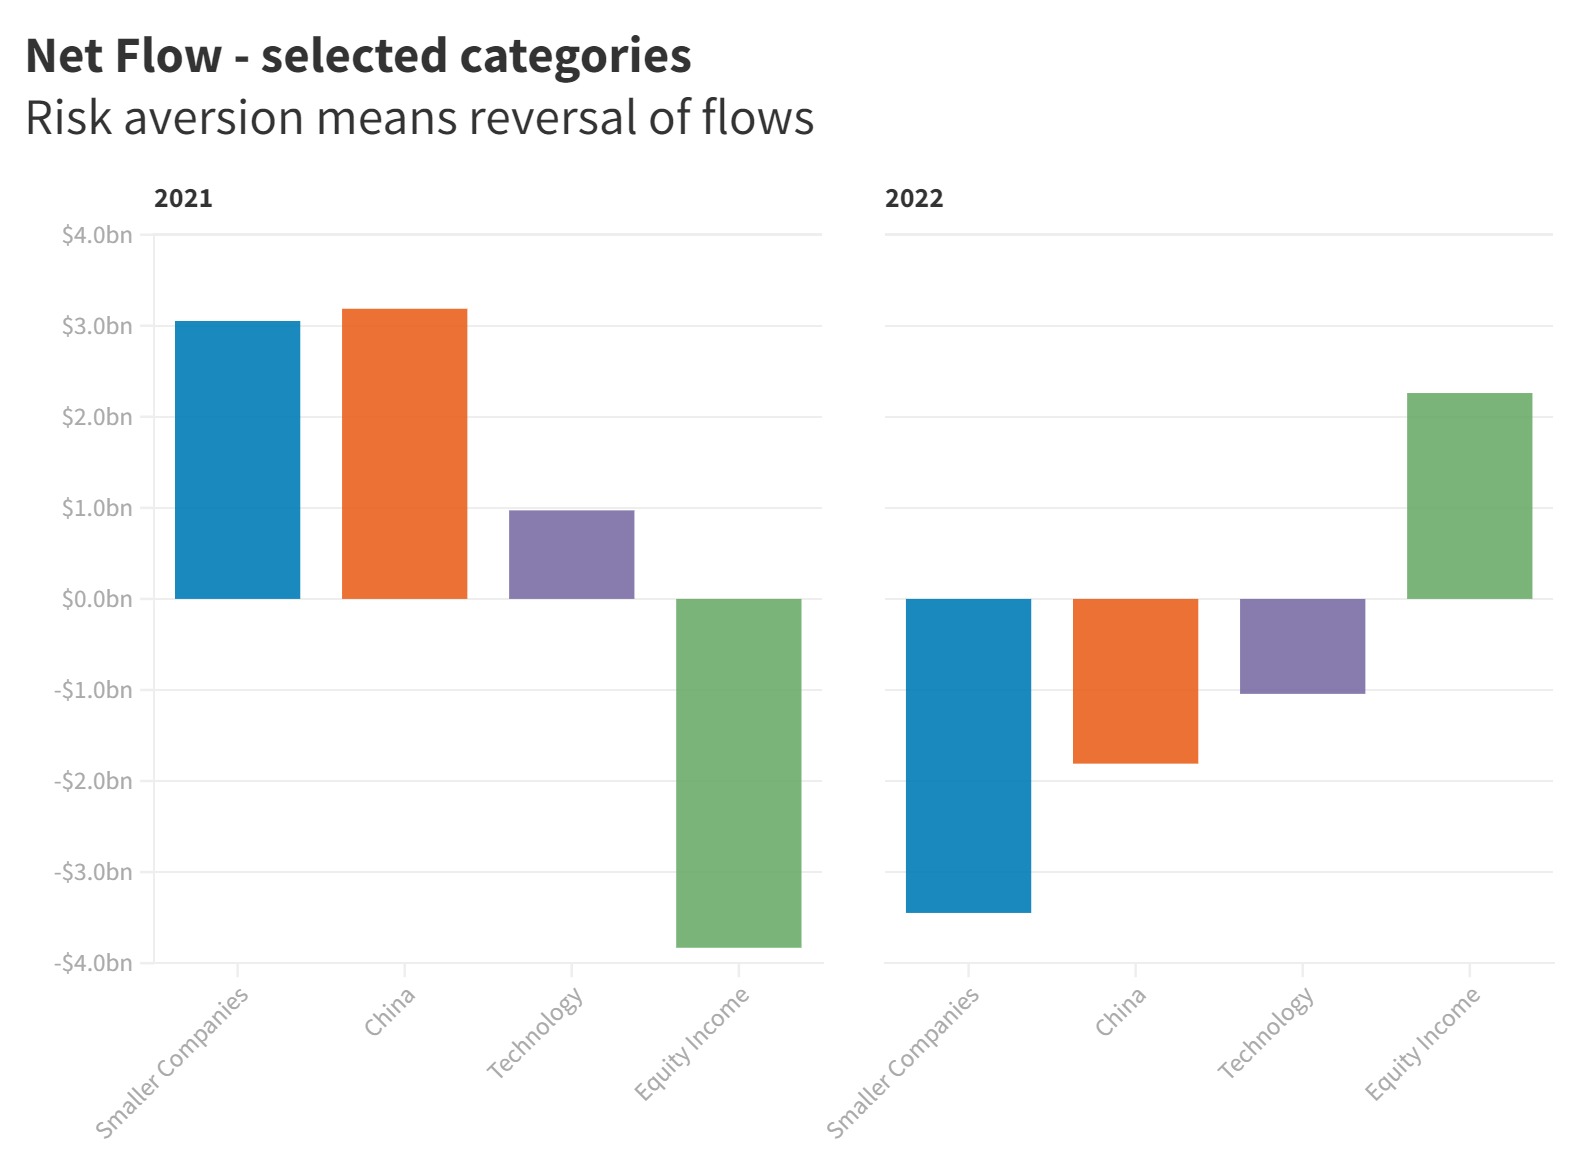
Smaller companies were crushed by rising risk aversion
The flight to safety was not just evident from the overall outflow of capital from funds to the haven of cash, but also in the complexion of these outflows. Risk aversion was clear in the greater focus on selling down funds specialising in smaller company investment. These had benefited very strongly from inflows in 2021 as record low bond yields pushed up the value of growth assets. $3.1bn of inflows in 2021 turned into $3.4bn of outflows in 2022 as smaller company valuations were crushed by rising rates and the acknowledgement that smaller businesses are typically less resilient in the face of an economic slowdown.
Tech crunch drove outflows
The spectacular crash in the share prices of some of the biggest tech firms in the world in 2022 was emblematic of the wider sector. Technology company valuations are extremely sensitive to market interest rates and as these rose tech multiples crunched lower. Specialist technology funds, which are a small but noteworthy category, saw inflows turn to outflows for the first time on our record. These funds shed $1.0bn in 2022. Every month saw capital leave the sector, with the first half showing the greatest outflows, correlating with the most savage phase of the bear market. A recovery in the valuation of some technology companies more recently has not yet tempted investors back into pure tech funds. Since market conditions improved in November, it seems investors have been content to gain exposure to the sector via bigger regional or global funds rather than sector specialists.
Zero Covid – Zero Fund Flows
Funds focused on Chinese equities had a tough 2022. As the rest of the world moved on from the pandemic, China remained stuck in a doom loop of draconian lockdowns. China country funds are relatively small in the global context, but they show that investors betted against it throughout 2022. The Chinese government has finally abandoned its futile attempt to prevent the virus spreading, sparking an enormous wave of infection that, in the short term at least, is as disruptive to the economy as lockdowns. This policy decision therefore did not move the dial on fund flows – investors remained negative. Those in Europe, the UK and Australia all pulled cash out of China funds, while those in China’s neighbouring countries, sharply reduced their net purchases during 2022. For the full year, outflows totalled a net $1.8bn, with an exceptionally low 42.2 Fund Flow Index reading, indicating that sell orders were almost 40% larger by value than buy orders – an unusually large gap and a clear vote of no confidence in China.
ESG – a bright spot in a gloomy sky
Equity funds with an ESG mandate were by far the most resilient sector in 2022. Inflows remained strong at $8.2bn, admittedly down by three quarters year-on-year from 2021’s record levels, but contrasting sharply with $21.5bn of outflows from funds without an ESG mandate. Global ESG funds are by far the most popular subcategory.
Investors in every region except Europe were net buyers of ESG funds during 2022. The UK remained the stronghold for the category, where ESG funds have proven more attractive to investors than those without such a mandate in all of the last three years. But it has grown significantly in popularity in the last two years in Australia too – inflows to ESG funds dropped by just one seventh in 2022 compared to a fall of three quarters for inflows to non-ESG funds.
Income Funds – defensive
Income funds were unloved during the boom years. Low interest rates favoured growth stocks rather than companies generating large amounts of income. 2022, however, saw inflows to income funds for the first time in at least 4 years. A net $2.3bn flowed into the sector, driven especially by European and to a lesser extent UK investors.
Active v Index – a tight race
Across our network, actively managed equity funds accounted for three quarters of the overall outflows from equity funds overall in 2022, with passive funds making up the rest. Clearly in cash terms, this shows that active funds were less able to hold on to investor capital, but relative to funds under management, on which measure active funds in our markets are still dominant, the outflows were roughly proportional. Moreover, our Fund Flow Index was almost identical for both categories, at 48.8 for active and 48.9 for passive funds.
Appetite for ESG funds, especially among UK investors, was the key reason why active funds held their own in 2022. Without this support, it is quite likely they would have done significantly worse.
Bonds have not provided shelter from volatile equity markets
Bond and equity markets have been strongly correlated in recent years, both addicted to infusions of cheap money from central banks. Their historic role as natural hedges against one another has weakened significantly – bond markets used to do better during recessions when expectations for interest rates were falling, while equities would do better in times of growth as earnings expectations rose. This has left investors with difficult choices to make about diversification and risk management. Alternative investments like hedge funds or structured products may not be suited to retail investors because they are complex, though categories like infrastructure or green energy have emerged as useful options. Cash remains an obvious choice, but it almost always loses value in real terms, even when inflation is not at 40-year highs.
The net outflows we have seen over the last year suggests investors are mainly parking their capital in cash.
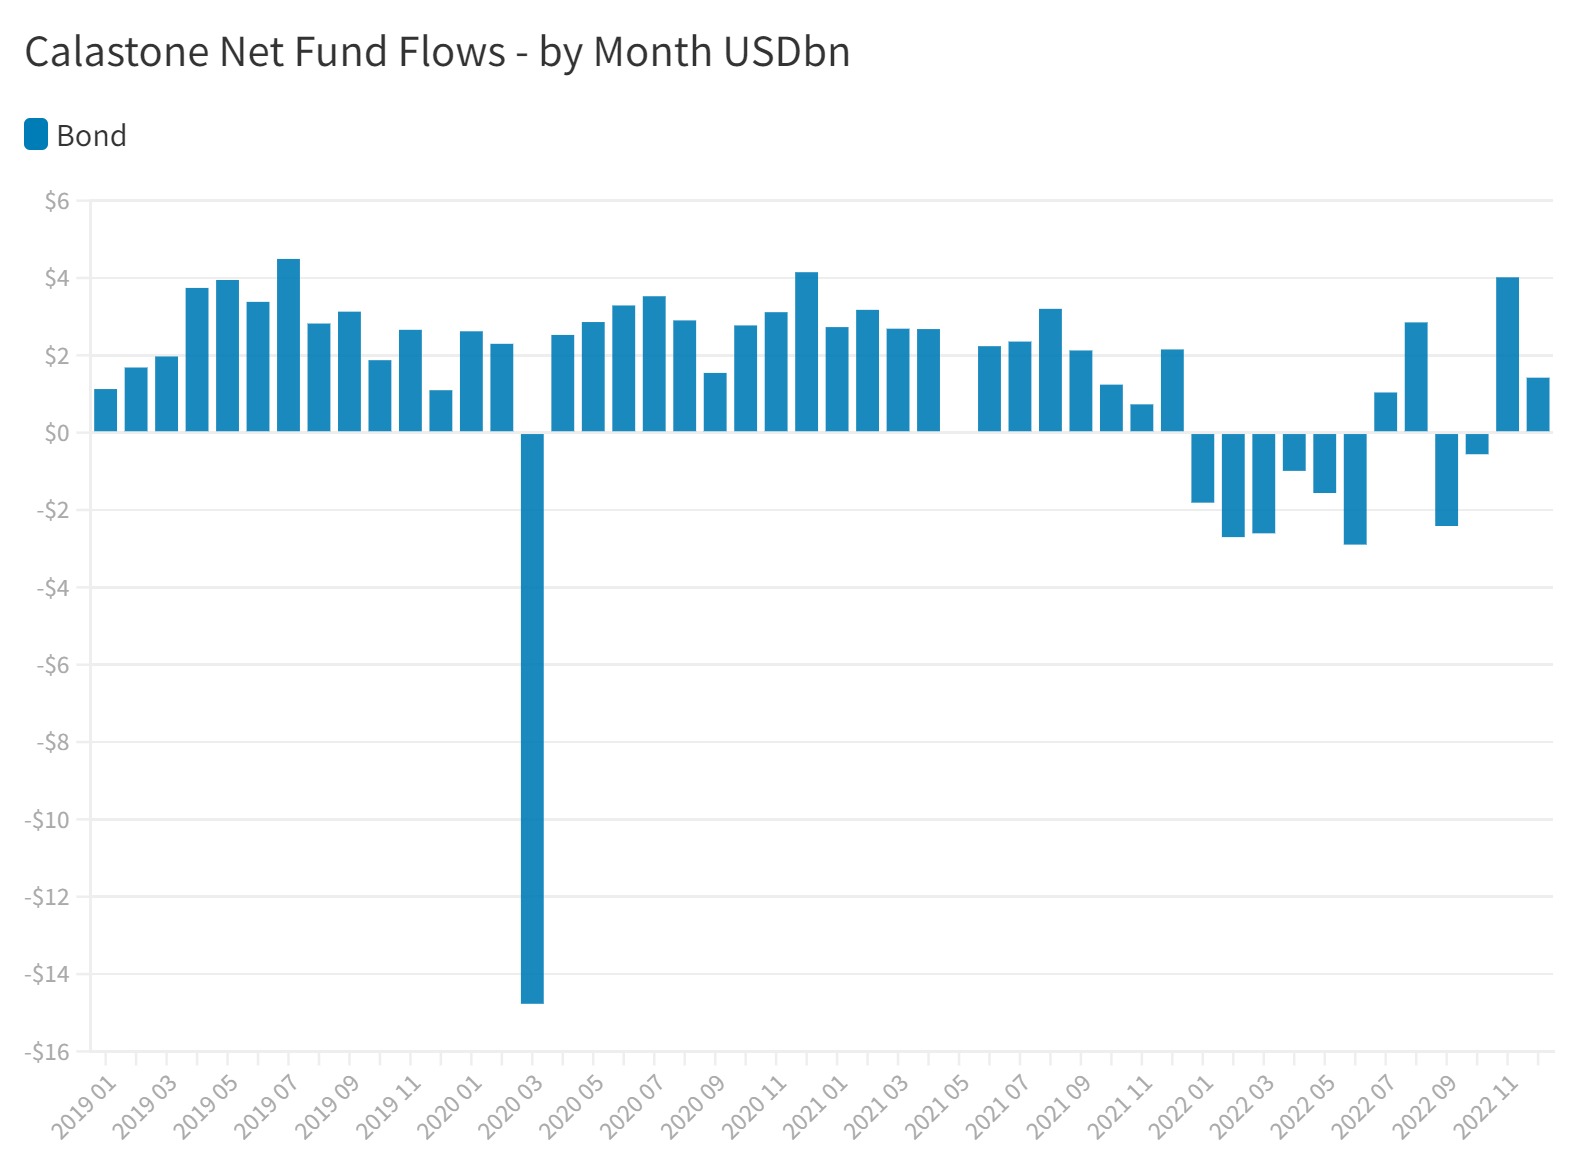
Fixed income funds enjoyed strong inflows in 2021, 2020 and 2019 (the earliest year we have collated global data). Our longer history of UK fund flows suggests investors everywhere have added to bond funds every year since at least 2015. 2022 broke the trend. As inflation accelerated and made soaring interest rates inevitable, investors took fright and in January 2022 capital began to drain out of fixed income funds. In the first half of 2022 outflows took place in every month, totalling a net $12.6bn, half the inflow seen during all of 2021. The second half of the year saw the July and August bear-market rally spur a flurry of inflows as sellers melted away before late August’s and early September’s major market upheaval once again led to outflows. Lower energy prices and signs of inflation peaking in November and December prompted investors to return to fixed income. For the full year, fixed income funds shed $6.2bn, leaving our Fund Flow Index for the asset class at 48.8, well below the very positive 54.4 in 2021.
Buyers jumped back into the market in November – taking advantage of higher yields
As with equity funds, 2022’s outflow was driven by a dearth of buyers not by additional selling pressure. The value of sell orders was almost exactly unchanged year-on-year. But the November rally was driven by significantly higher buy orders, unlike equities where late-year inflows were more a function of reduced selling. Enticing yields help explain why fixed-income buyers upped their activity. By this time, new buyers were adding cash at significantly more attractive yields than twelve months before – securing up to six times more income on each dollar invested.
Investors in Europe, Hong Kong, Singapore and Taiwan were most negative on fixed income and were responsible for all the outflows. Those in the UK and Australia cut their purchases significantly year-on-year, down by 66% and 92% respectively, but were still net buyers for the full year.
Mixed assets are better anchored in regular savings plans
Despite a very sharp fall in the volume of orders in mixed asset funds, investors remained net buyers over the course of the year. A net $8.1bn flowed into these funds, down 78% year-on-year. There is generally much less variation in fund flows for mixed assets than for particular asset classes. This likely reflects their relatively well anchored role in the savings plans of many investors. If you are worried about equity markets in particular, for example, you are more likely to target particular equity funds than tinker with a diversified fund invested across asset classes. Investors in all our regions reduced their buying of mixed asset funds in 2022, but only those in Singapore saw net outflows – just barely.
Property is vulnerable to an economic slowdown
The global property market is vulnerable to higher interest rates and to economic slowdowns. Our figures are skewed by the limits placed on redemptions in a number of large UK funds but outflows continued during 2022. Australians remained notably more optimistic on property than their European and UK counterparts, while in the rest of Asia-Pacific ex Japan our data is more limited and does not permit us to draw strong conclusions other than to note a general move away from the sector.
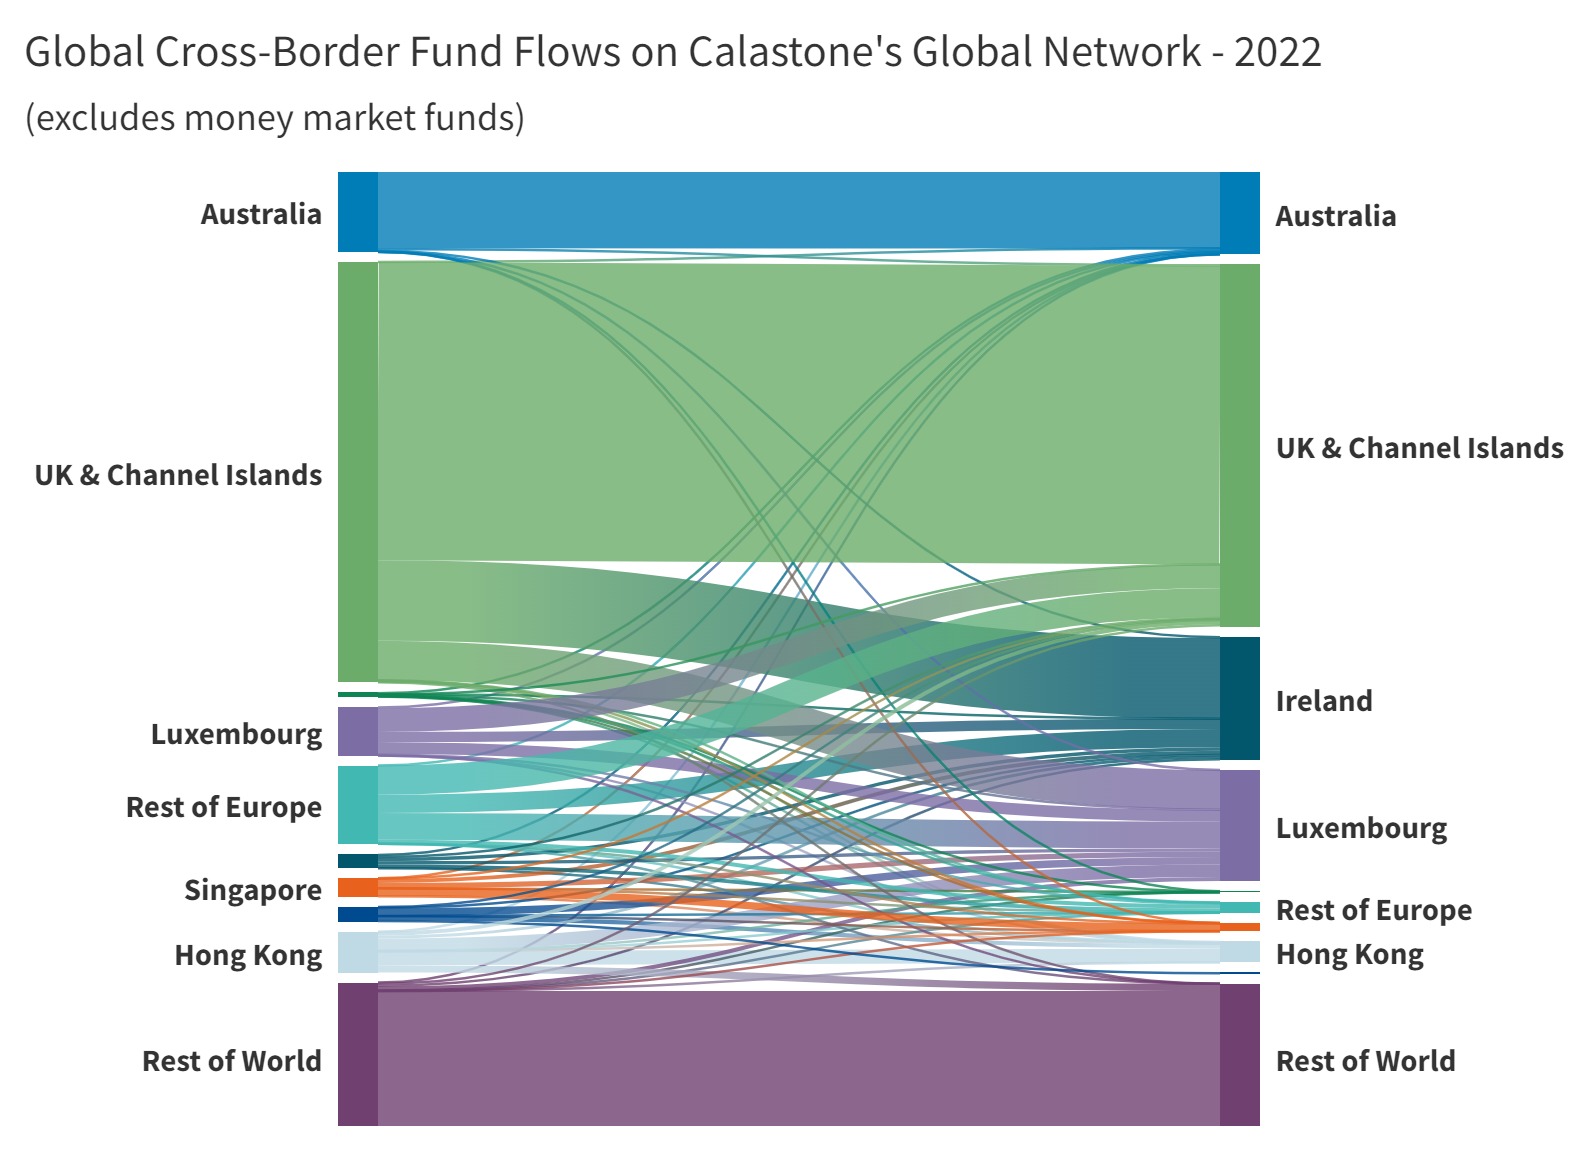
In 2022, 38.4% of the volume of fund flows we handled on our network crossed a border. This is just a fraction more than 2021 (38.1%) but it up markedly on 2019, when 34.6% of the value we processed moved from one jurisdiction to another. The big fund centres of Luxembourg and Ireland remained the most important destinations for international fund traffic.
Fund managers and investors alike cheered the rebound in asset values that took place in the last few weeks of 2022, but markets are still volatile as a result of uncertainty over how inflation, economic growth, corporate earnings, energy prices, geopolitical turbulence and supply-chain snarl-ups will develop in the months ahead – and these are just the known unknowns.
2023 will present its own new set of challenges as well, but those asset managers who are able to embrace these challenges and leverage technology to find opportunities in the midst of volatility will be well positioned for success in the coming year.
Along with the impact of lower AUM on fees, fund managers are facing industry-specific challenges too: dwindling margins, fee compression, new asset classes competing for investor dollars, emerging competitors and evolving customer expectations. Investor demographics and attitudes have changed, technology has evolved, and yet investment products, infrastructure and user experience have failed to keep up. Investors expect all the advantages of a modern, digital experience, but mutual funds still rely on fragmented supply chains that add time and expense to what should be a simple process of delivering investment products.
When markets are strong and AUM is riding high, it is easy to lose the sense of urgency for change. Fee income is supported by asset values and investors overlook the impact of fees on investment performance when they are making big gains on their funds. When markets are weak, fees take a more painful bite, so the need to strip needless cost out of the process is much more acute – and benefits both fund managers and their customers.
The industry has reached an inflexion point. Supported by regulators and progressive voices in the industry, we are helping reinvent how investments are made. Asset managers can now bypass outdated infrastructure by ‘tokenising’ new mutual funds, eliminating layers of cost and administration in the process. It is still early days, but the shift has begun. We expect most asset managers to adopt tokenisation in the years ahead. It will be gradual at first, but once a critical mass has been reached change will follow quickly for the rest.
Cost reduction is the purest form of alpha and is an easy win for asset management firms. Calastone can help them capture it.