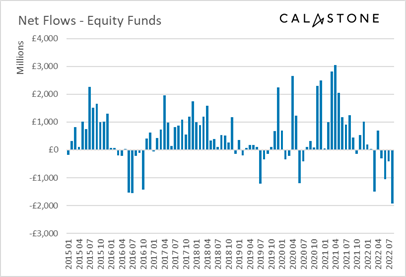
August saw record selling of equity funds – £1.93bn
UK investors rushed for the exits in August, pulling a record net £1.93bn from equity funds, according to the latest Fund Flow Index from Calastone, the largest global funds network. The outflow easily beat the previous records set in June and July 2016 when the Brexit vote prompted a net outflow of £1.54bn and £1.56 bn respectively. August’s net outflow was driven by a significant increase in selling activity rather than a drop-off in buy orders, indicating a decisive choice to exit holdings.
Bear-market rally saw £2.33bn withdrawn from equity funds between mid-July and mid-August
A bear-market rally that began in the middle of July and continued in the first half of August saw global stock markets rise sharply[1]. Unconvinced, UK investors sold their equity fund holdings into the rally, withdrawing a modest £251m in the second half of July ramping up to 2.08bn between August 1st and August 17th at which point the rally ran out of steam and share prices quickly deflated again. Between August 18th and 31st, investors sat on their hands, adding an insignificant £153m to their holdings.
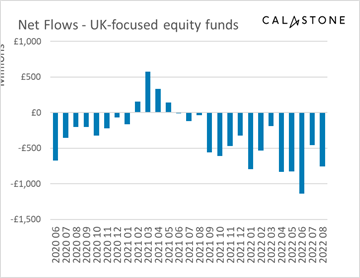
All geographies saw outflows, with record selling in North American and Asia-Pacific funds
Every geographical category of equity fund saw outflows in August. UK-focused funds were worst hit, shedding £759m, the fifth worst month on record (all the other four have been in 2022 too). At two fifths of the total outflow, this was a noticeably larger share than UK-focused equity funds’ share of assets under management[2]. UK investors have pulled cash from domestically focused funds for a record 15 consecutive months now. North American equities saw the next largest outflow, at a record £426m for this category. It was also a record bad month for Asia-Pacific (£234m outflow) thanks to rising concerns over the Chinese economy and its effects on the regional ecosystem, while European equities had their sixth worst month on record (£419m outflow). Even emerging-markets funds, which have benefited strongly from inflows in 2022 thanks to large weightings to booming oil companies, saw outflows. Income funds joined all these in outflow territory too.
Sector funds focused on renewable energy and infrastructure enjoyed inflows, as did ESG equity
The only category of equity fund to see inflows were those with a particular sector focus. Investors added a net £146m, a little ahead of the £99m monthly average of the last five years. The inflows were dominated by infrastructure and renewable energy funds, accounting for more than half the net inflow to sector funds overall. Separately, funds with an ESG mandate, which cut across all geographical and sector categories also saw inflows, though at just £95m, the new capital was the lowest since September 2019, when ESG funds were just beginning their astonishing £20bn gold rush[3].
Equity funds have shed £4.3bn year-to-date
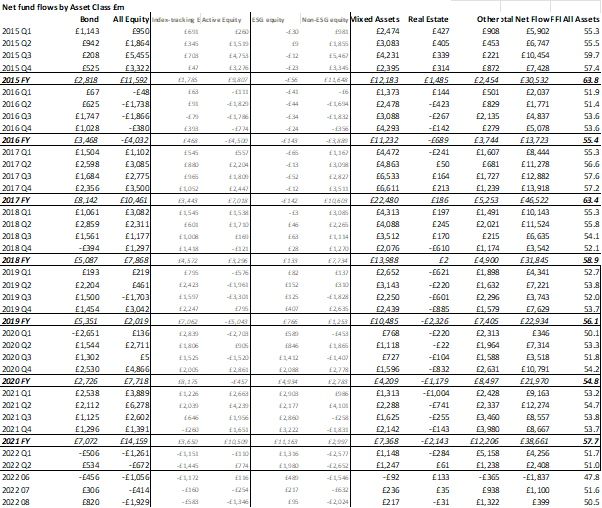
Since the beginning of 2022, equity funds overall have shed £4.3bn. Only the eight-month period between March and October 2016 have seen larger outflows (£5.2bn) on Calastone’s eight-year record.
Among other asset classes, bond funds saw inflows of £820m, despite the difficult conditions in the bond markets. Calastone noted, however, that there was a bias towards funds focused on short-dated bonds, which are less volatile. Property funds also saw outflows resume after a brief two months hiatus from selling activity that had until May extended uninterrupted over several years.
Edward Glyn, head of global markets at Calastone said: “Bear-market rallies are often triggered during an extended market decline and have a variety of causes, including short sellers covering their positions, but it is always worth looking at the wider context. When central bankers tell you unambiguously how determined they are to squeeze out inflation, even if that means generating a painful recession, it pays to listen. Markets are absorbing the likelihood that inflation will be extremely pernicious and persistent meaning that interest rates will stay higher for longer than initially expected. The combination of a weaker economy and higher rates is very negative for share prices, especially of growth stocks.
Attempting to time the market is often a bad idea, but this time UK investors may have played a blinder, jumping ship just as the bear rally peaked.
It’s not all bad news. Sector funds are bucking the trend because of sector-specific factors – infrastructure assets usually come with inflation protection built into operating contracts which helps underpin capital values, while renewable energy generators are making vast amounts of cash as they sell cheap green power at the marginal price set by exorbitant market rates for gas. These funds are a tiny part of the UK’s funds market but they are providing a valuable counterweight for some investors in these volatile times.”
[1] 14/7/22 to 16/7/22: MSCI World +12.9%; FTSE 100 +7.1%
[2] UK equity funds represent 27% of equity fund AUM – source IA, June 2022
[3] January 2019 to August 2022, net inflows of £20.5bn; Sep 2019 to Aug 2022 net inflows £20.1bn
METHODOLOGY
Calastone analysed over a million buy and sell orders every month from January 2015, tracking monies from IFAs, platforms and institutions as they flow into and out of investment funds. Data is collected until the close of business on the last day of each month. A single order is usually the aggregated value of a number of trades from underlying investors passed for example from a platform via Calastone to the fund manager. In reality, therefore, the index is analysing the impact of many millions of investor decisions each month.
More than two thirds of UK fund flows by value pass across the Calastone network each month. All these trades are included in the FFI. To avoid double-counting, however, the team has excluded deals that represent transactions where funds of funds are buying those funds that comprise the portfolio. Totals are scaled up for Calastone’s market share.
A reading of 50 indicates that new money investors put into funds equals the value of redemptions (or sales) from funds. A reading of 100 would mean all activity was buying; a reading of 0 would mean all activity was selling. In other words, £1m of net inflows will score more highly if there is no selling activity, than it would if £1m was merely a small difference between a large amount of buying and a similarly large amount of selling.
Calastone’s main FFI All Assets considers transactions only by UK-based investors, placing orders for funds domiciled in the UK. The majority of this capital is from retail investors. Calastone also measures the flow of funds from UK-based investors to offshore-domiciled funds. Most of these are domiciled in Ireland and Luxembourg. This is overwhelmingly capital from institutions; the larger size of retail transactions in offshore funds suggests the underlying investors are higher net worth individuals.