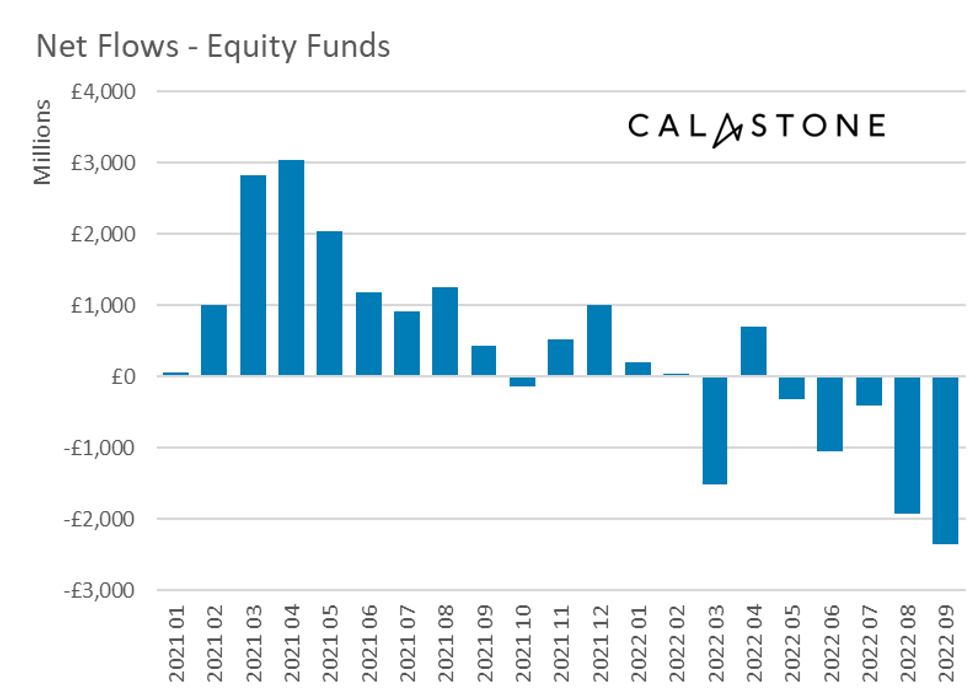
Turmoil in global markets prompted a new record flood of capital out of equity funds in September, according to the latest Fund Flow Index from Calastone, the largest global funds network. The £2.36bn net outflow beat the previous record set in August by over a fifth and takes the net flight from equity funds to £6.63bn since the bear market began in January 2022. During the third quarter, the outflow reached £4.70bn, comfortably more than in the whole of 2016, which was previously the worst year on Calastone’s eight-year record.

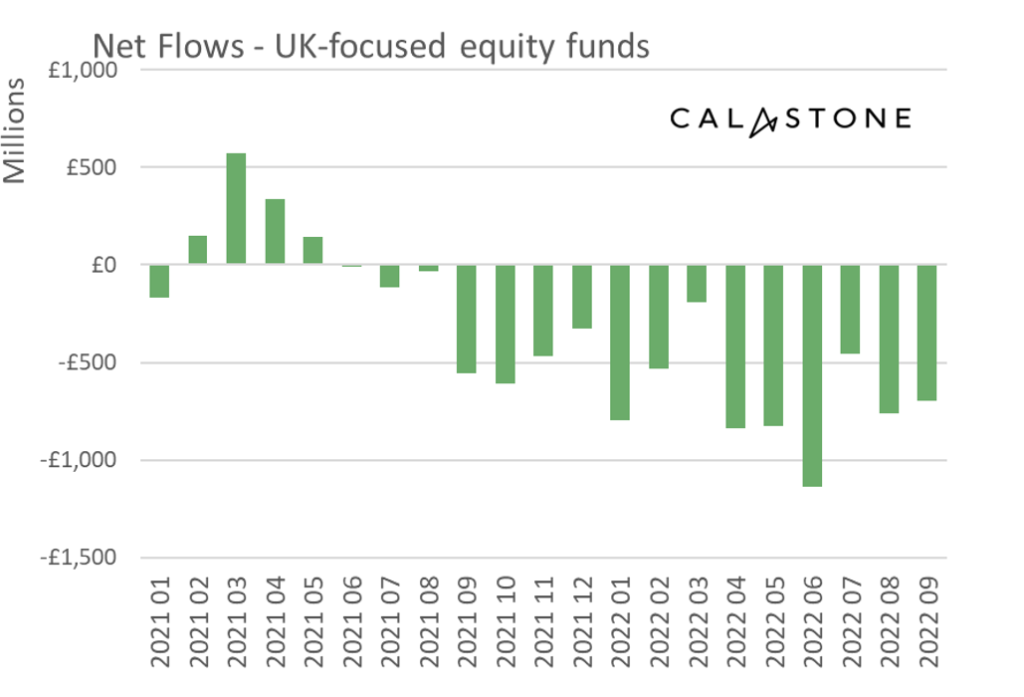
UK-focused equity funds hit hardest in September – now 16 consecutive months of outflows
Investors continued to pummel funds focused on UK equities. These saw net selling of £694m, the sixteenth consecutive month of net outflows, a longer stretch than for any other major equity fund category. Until 2022, September’s outflow would have marked a record for UK-focused funds, but sentiment on UK assets has been so negative recently that it only ranked sixth.

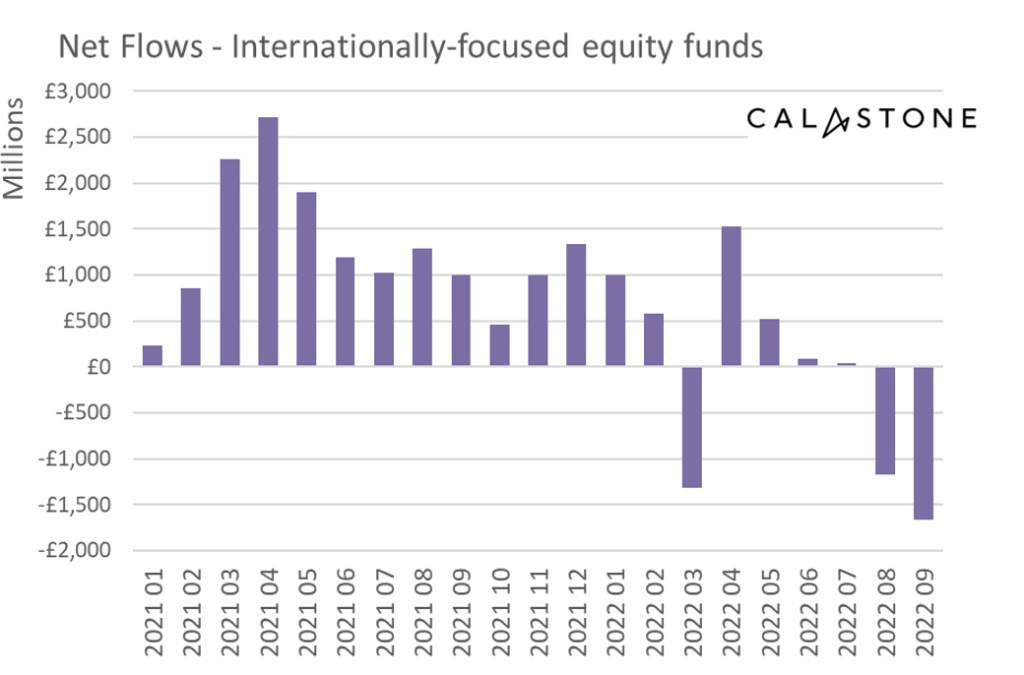
Every geography saw outflows, with records broken for US and emerging market equities
UK-focused funds were hit hardest in September, but every other geography saw significant outflows too. Among the most notable, US equity funds had their worst month on record (beating August’s record outflow) shedding a net £497m of capital. The strains caused by the extreme strength of the US dollar and the sharp economic slowdown in China drove a record £116m of net outflows from emerging market funds and £223m from Asia-Pacific (second only to August’s record).

Active funds now being hit harder than passive funds after resilient first half of 2022
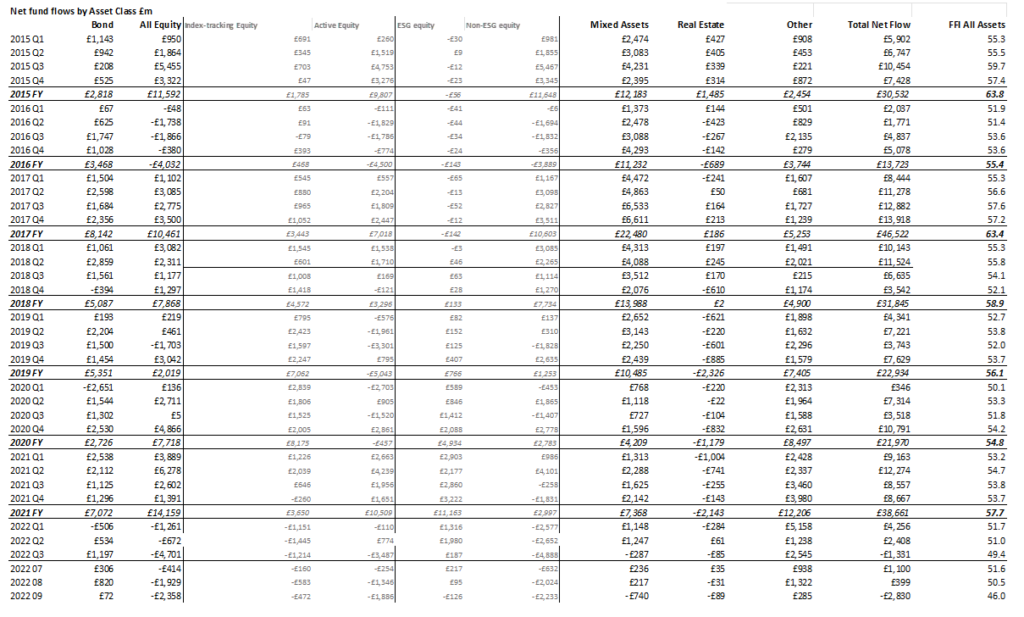
Active equity funds had proven relatively resilient for most of 2022, with either lower net outflows or higher net inflows each month than their passive counterparts. But in the past two months the pattern has reversed. Active funds were hit with record net outflows of £1.89bn in September compared to £472m from passive funds.
ESG equities suffer first outflow in 3.5 years
A sharp reversal in appetite for ESG equity funds helps explain the loss of interest in active equities. In September, ESG equity funds shed a net £126m of cash, the first outflow in over three-and-a-half years.
The only equity category to see inflows was specialist sector funds, especially those focused on infrastructure and renewables. Sector funds enjoyed inflows of £91m, taking the net total to £3.5bn over 23 consecutive months of inflows.
Record outflows from mixed assets and renewed loss of appetite for property
The flight from risk was seen in other asset classes too. Property funds suffered £89m of outflows while mixed assets funds shed a record £740m. Inflows to fixed income funds slumped to £72m, turning sharply negative in the last week of the month, following the market’s savage reaction to the Chancellor’s mini-budget.
Edward Glyn, head of global markets at Calastone said: “The surge in global bond yields is driving a dramatic repricing of assets of all kinds. UK investors are voting with their feet and heading for the exits. The sensitivity to market interest rates of the big growth stocks that characterise the US market explains the record outflows there. For emerging markets, the support provided earlier in the year by high metals prices has been kicked away by the prospect of a global recession. The negative effects of the strong dollar for many emerging market economies are coming to the fore in its place. And the loss of momentum in China is leaching energy out of the Asia-Pacific economic ecosystem. Meanwhile the near-permanently frosty attitude towards UK assets shows no signs of thawing.
“A resumption of concerted selling in the property sector relates to the increased competitiveness of bond yields tempting income investors, concerns about occupancy levels in a possible recession and heightened refinancing risk linked to higher market interest rates. This has clearly been enough to offset the built-in inflation resilience of many property portfolios.”

METHODOLOGY
Calastone analysed over a million buy and sell orders every month from January 2015, tracking monies from IFAs, platforms and institutions as they flow into and out of investment funds. Data is collected until the close of business on the last day of each month. A single order is usually the aggregated value of a number of trades from underlying investors passed for example from a platform via Calastone to the fund manager. In reality, therefore, the index is analysing the impact of many millions of investor decisions each month.
More than two thirds of UK fund flows by value pass across the Calastone network each month. All these trades are included in the FFI. To avoid double-counting, however, the team has excluded deals that represent transactions where funds of funds are buying those funds that comprise the portfolio. Totals are scaled up for Calastone’s market share.
A reading of 50 indicates that new money investors put into funds equals the value of redemptions (or sales) from funds. A reading of 100 would mean all activity was buying; a reading of 0 would mean all activity was selling. In other words, £1m of net inflows will score more highly if there is no selling activity, than it would if £1m was merely a small difference between a large amount of buying and a similarly large amount of selling.
Calastone’s main FFI All Assets considers transactions only by UK-based investors, placing orders for funds domiciled in the UK. The majority of this capital is from retail investors. Calastone also measures the flow of funds from UK-based investors to offshore-domiciled funds. Most of these are domiciled in Ireland and Luxembourg. This is overwhelmingly capital from institutions; the larger size of retail transactions in offshore funds suggests the underlying investors are higher net worth individuals.


